
E-Commerce UX Design Case Study
By Mabel Lawler
Duration: May - June 2026
View Live Page Prototypes Below:
Product Overview
—
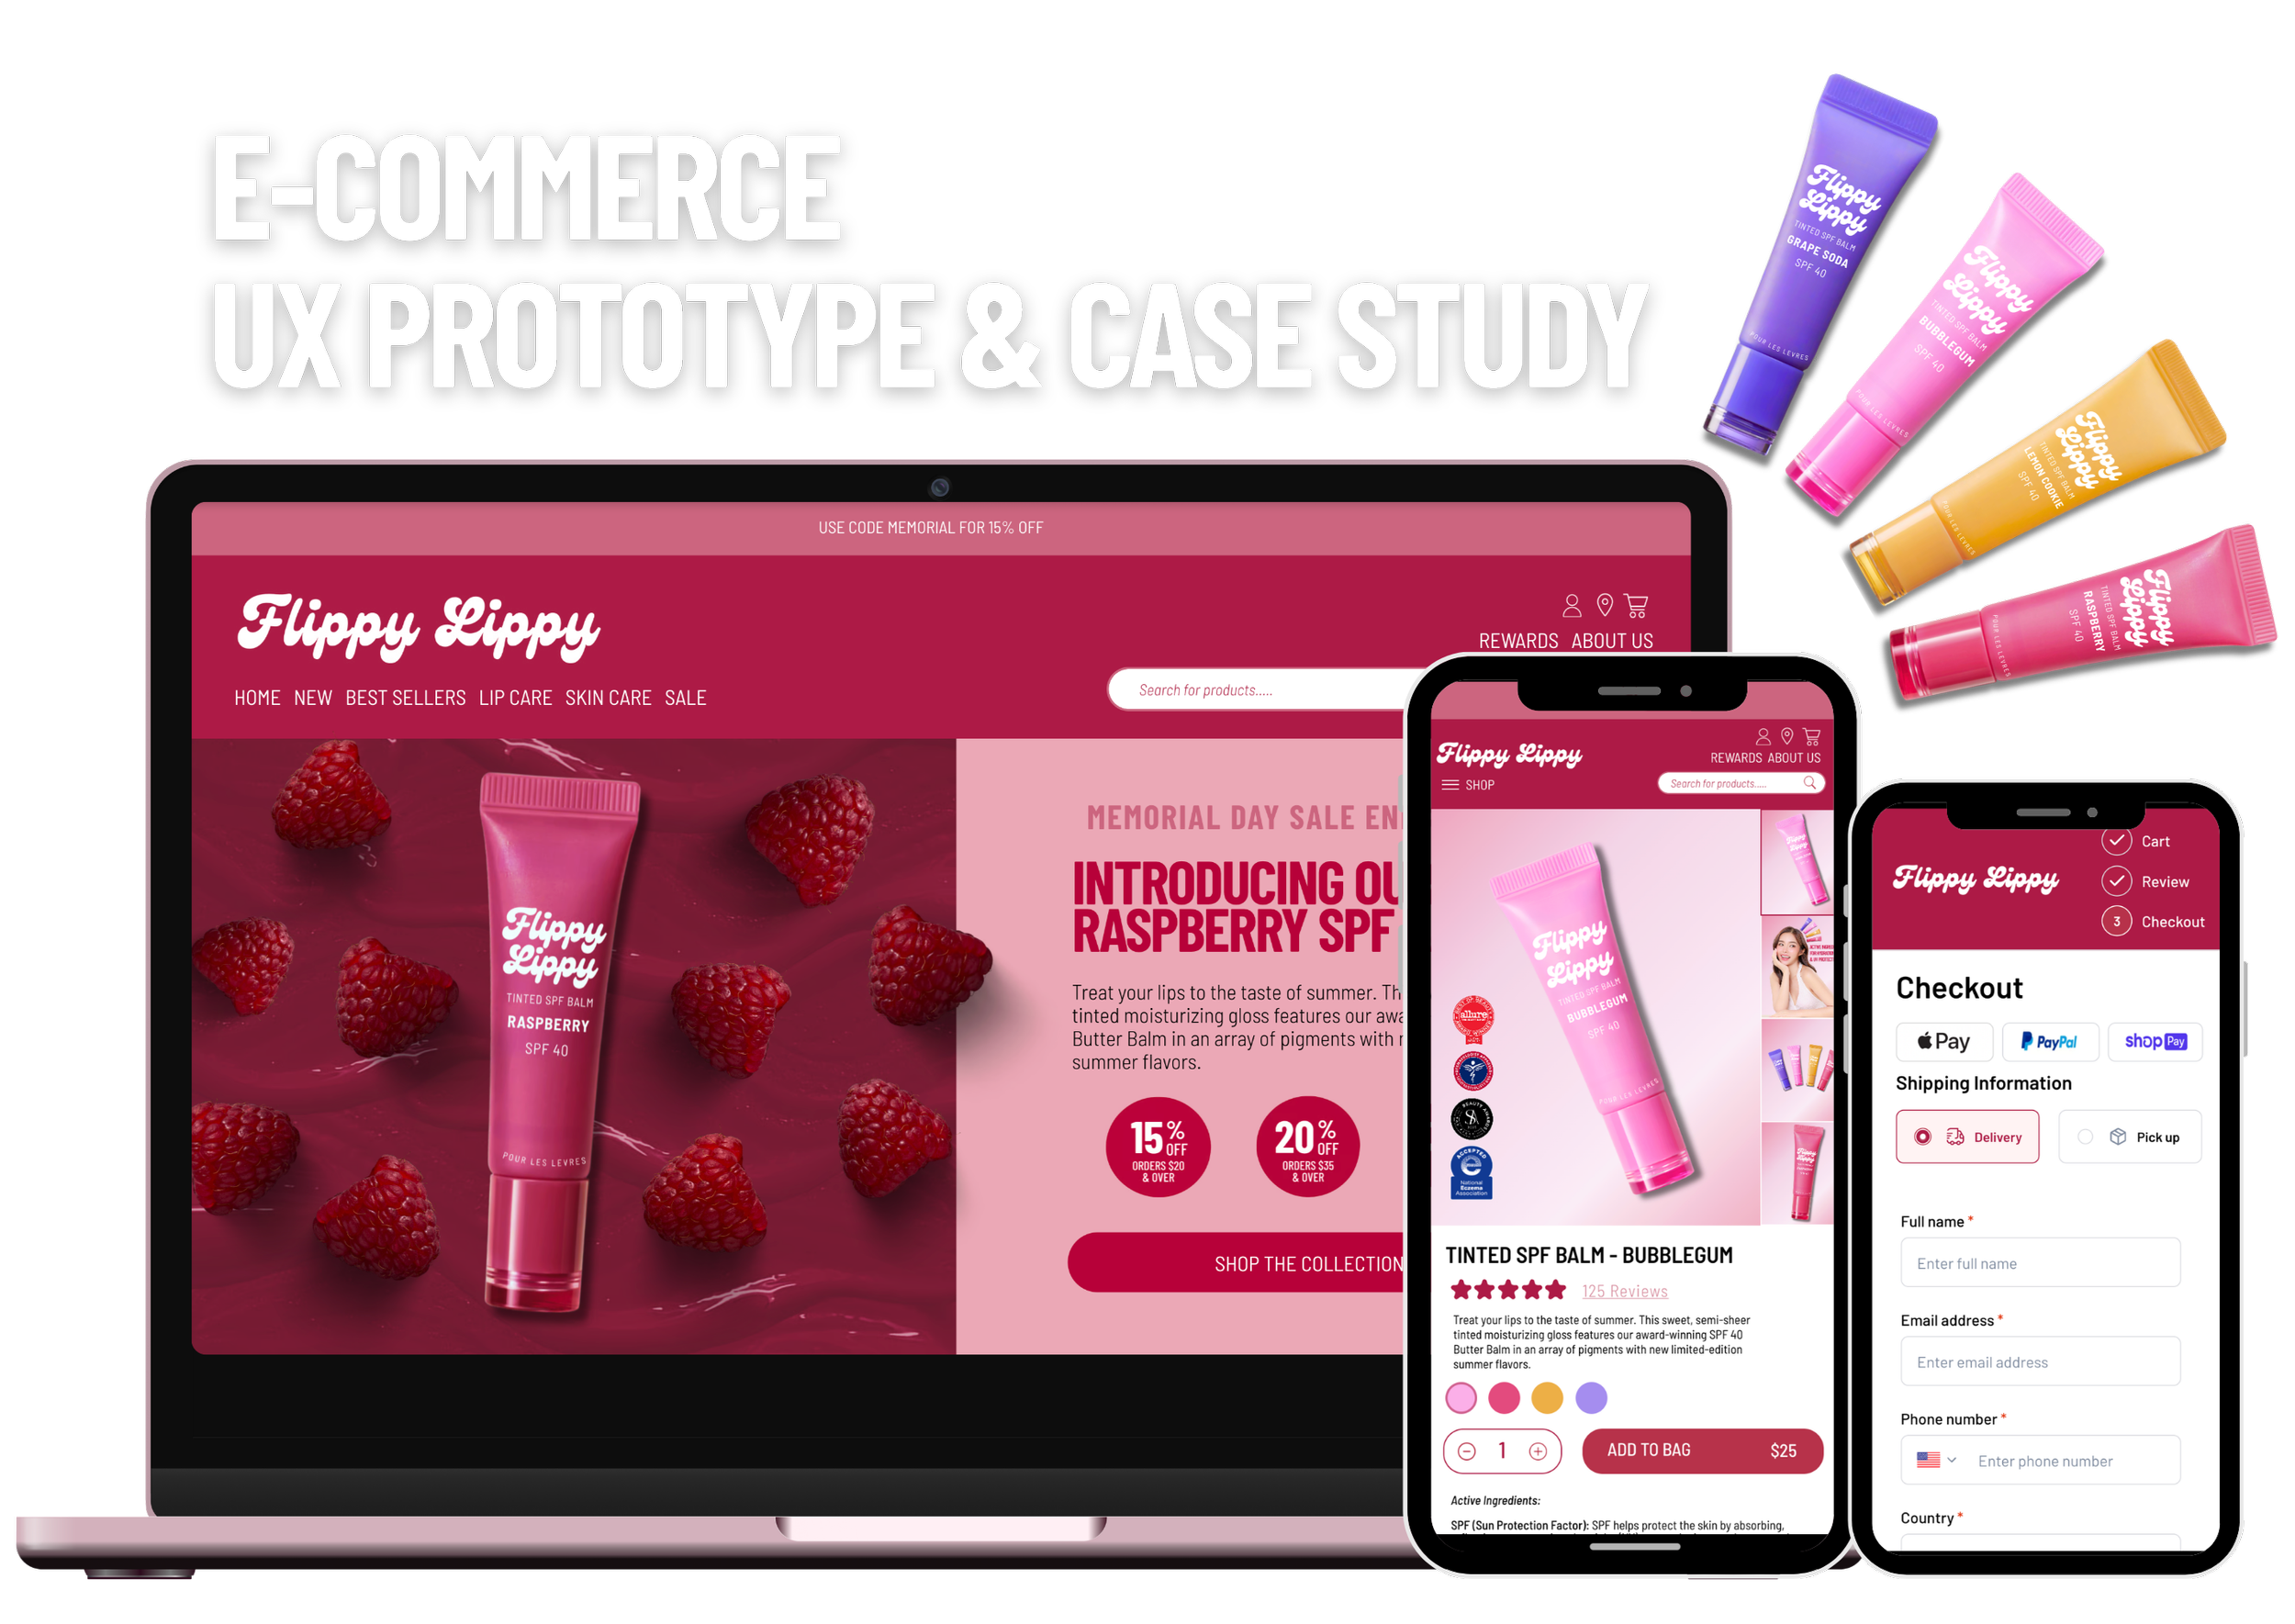
This case study outlines the end-to-end UX design of an optimized e-commerce product for ‘Flippy Lippy’, an imaginary skincare & beauty brand looking to combine it’s fun, fruity aesthetic with clinical credibility. Utilizing data-driven user research and best practices in structured design psychology, the final product features three high-impact e-commerce pages: the Home Page, Product Display Page (PDP), and Checkout Flow; each optimized to improve usability and decrease navigation and transaction friction. Each page has its own live site prototype for desktop & mobile, with a few interactive components implemented, which you can access above.
—
Tools
Figma
Adobe XD
Adobe Illustrator
Canva
Adobe Photoshop
Adobe InDesign
Figma Make
Leetcode
Visual Studio Code
Objectives
—
Home Page Objectives
Instantly communicate brand identity & values
Establish credibility & trust
Create frictionless paths to star products
Product Display Page Objectives
Visually attract customers to the product
Establish trust & credibility
Remove purchase hesitation
Checkout Page Objectives
Reduce transaction friction
Minimize cart abandonment risks
—
UX UI Strategy
Home Page Strategy
Establish the vibe immediately- introduce the fun, fruity, clean brand aesthetic of Flippy through an eye-catching hero, cohesive design hierarchy, and attractive images.
Lead with social proof to leverage brand authenticity & legitimacy -integrate social media or video content from customers / influencers into the site to build brand trust through social endorsement & product demonstration.
Create a frictionless path to the ‘star’ product- drives immediate traffic to the star product, removes all friction from having to navigate PLPs to find the most popular product.
Product Display Page Strategy
Attract customers with visually appealing product display images and dynamic carousels
Build trust & brand authenticity with digestible clinical ingredient explanations and unmissable safety credentials & awards
Convert curious browsers to buyers with easily accessible written & video product reviews from other customers. Remove purchase hesitation further by enlarging the checkout button or making the checkout button sticky on the page.
Checkout Page Strategy
Minimize transaction friction with an optimized, simplified checkout flow, especially for mobile transactions
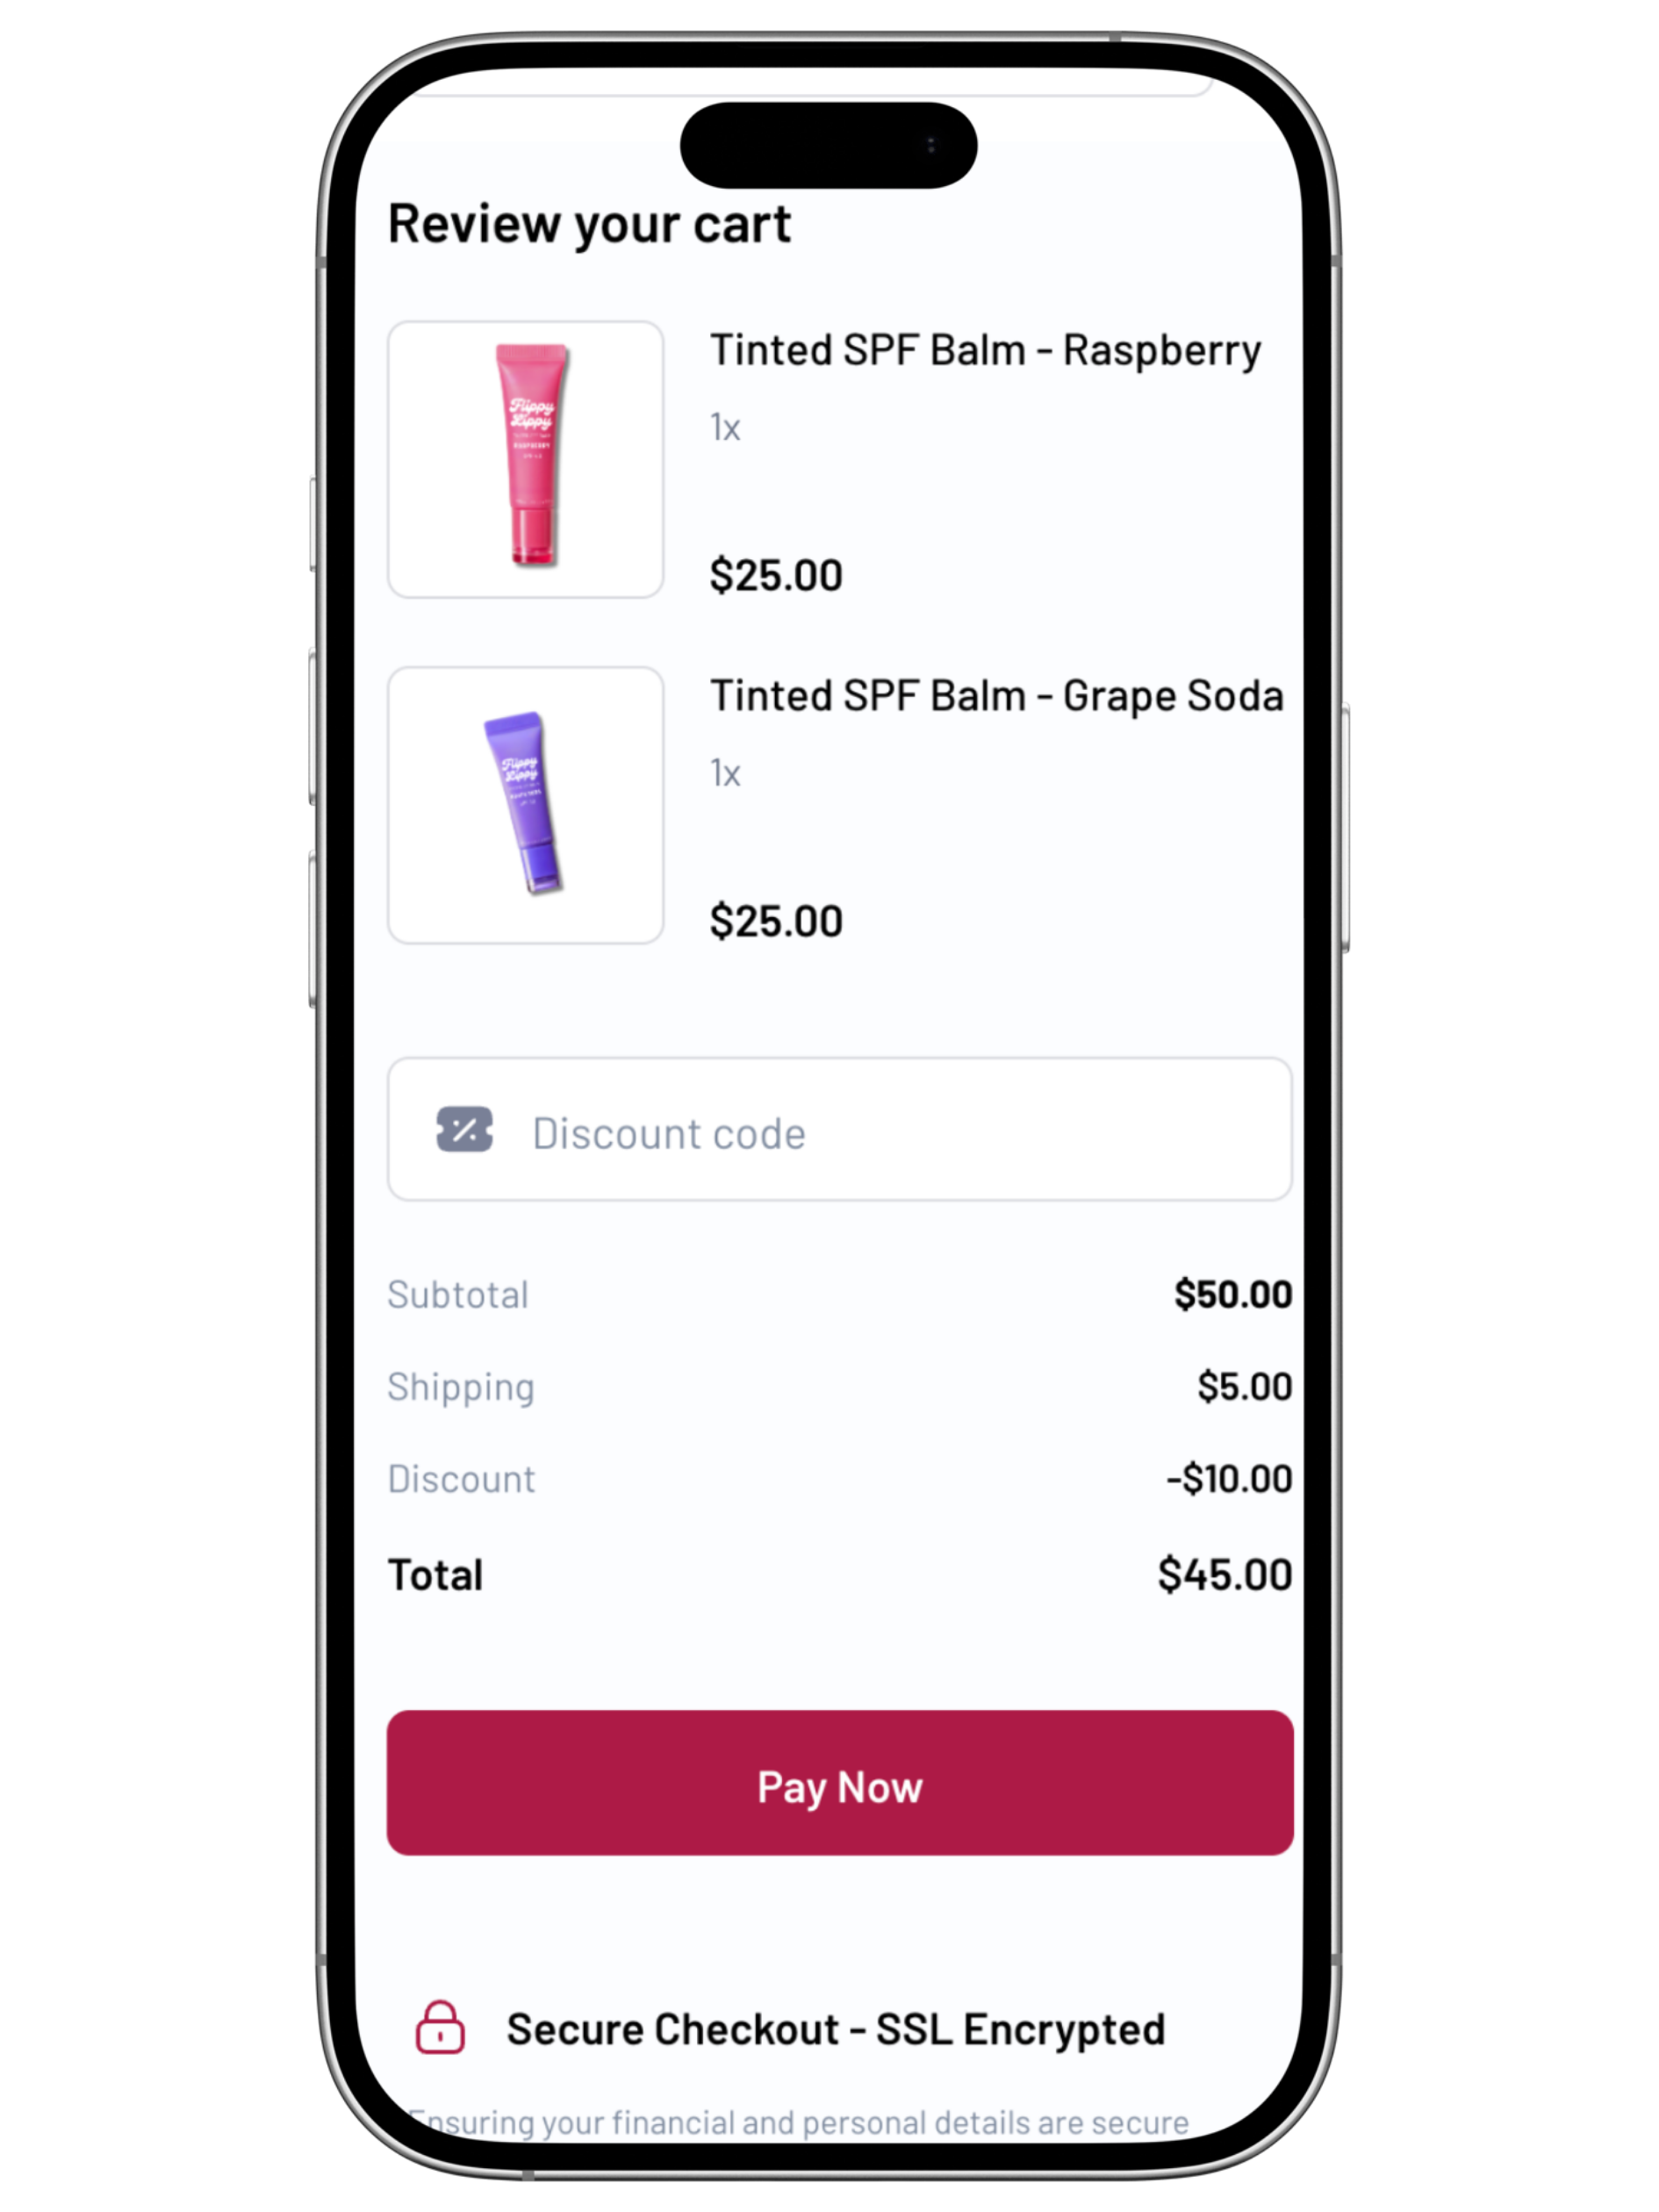
Maintain absolute transparency when calculating costs & additional fees - hidden fees are a major cause for abandoned carts.
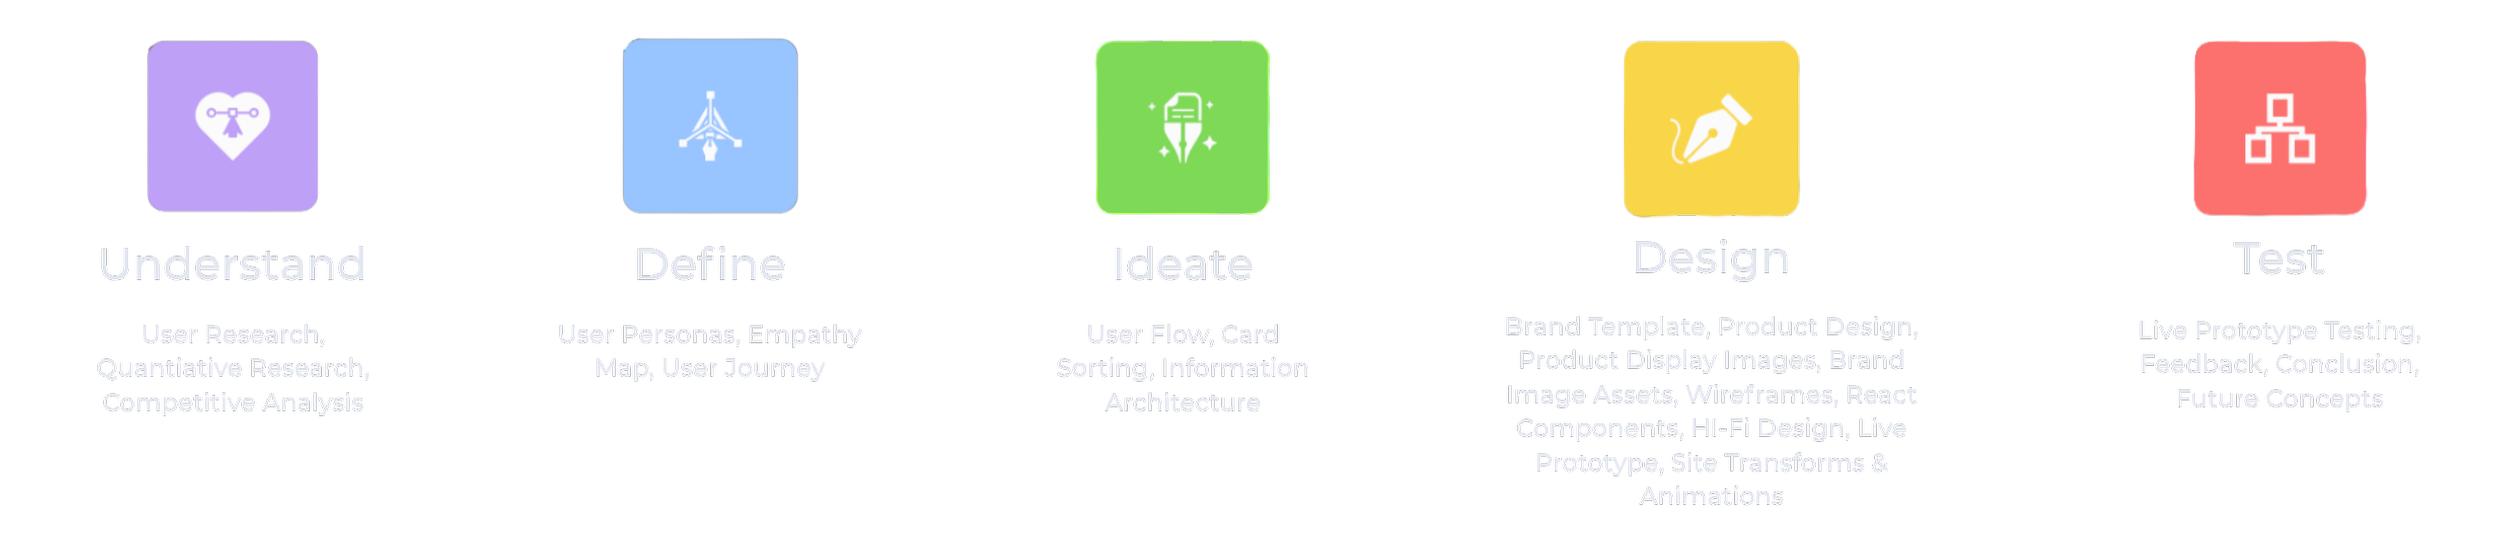
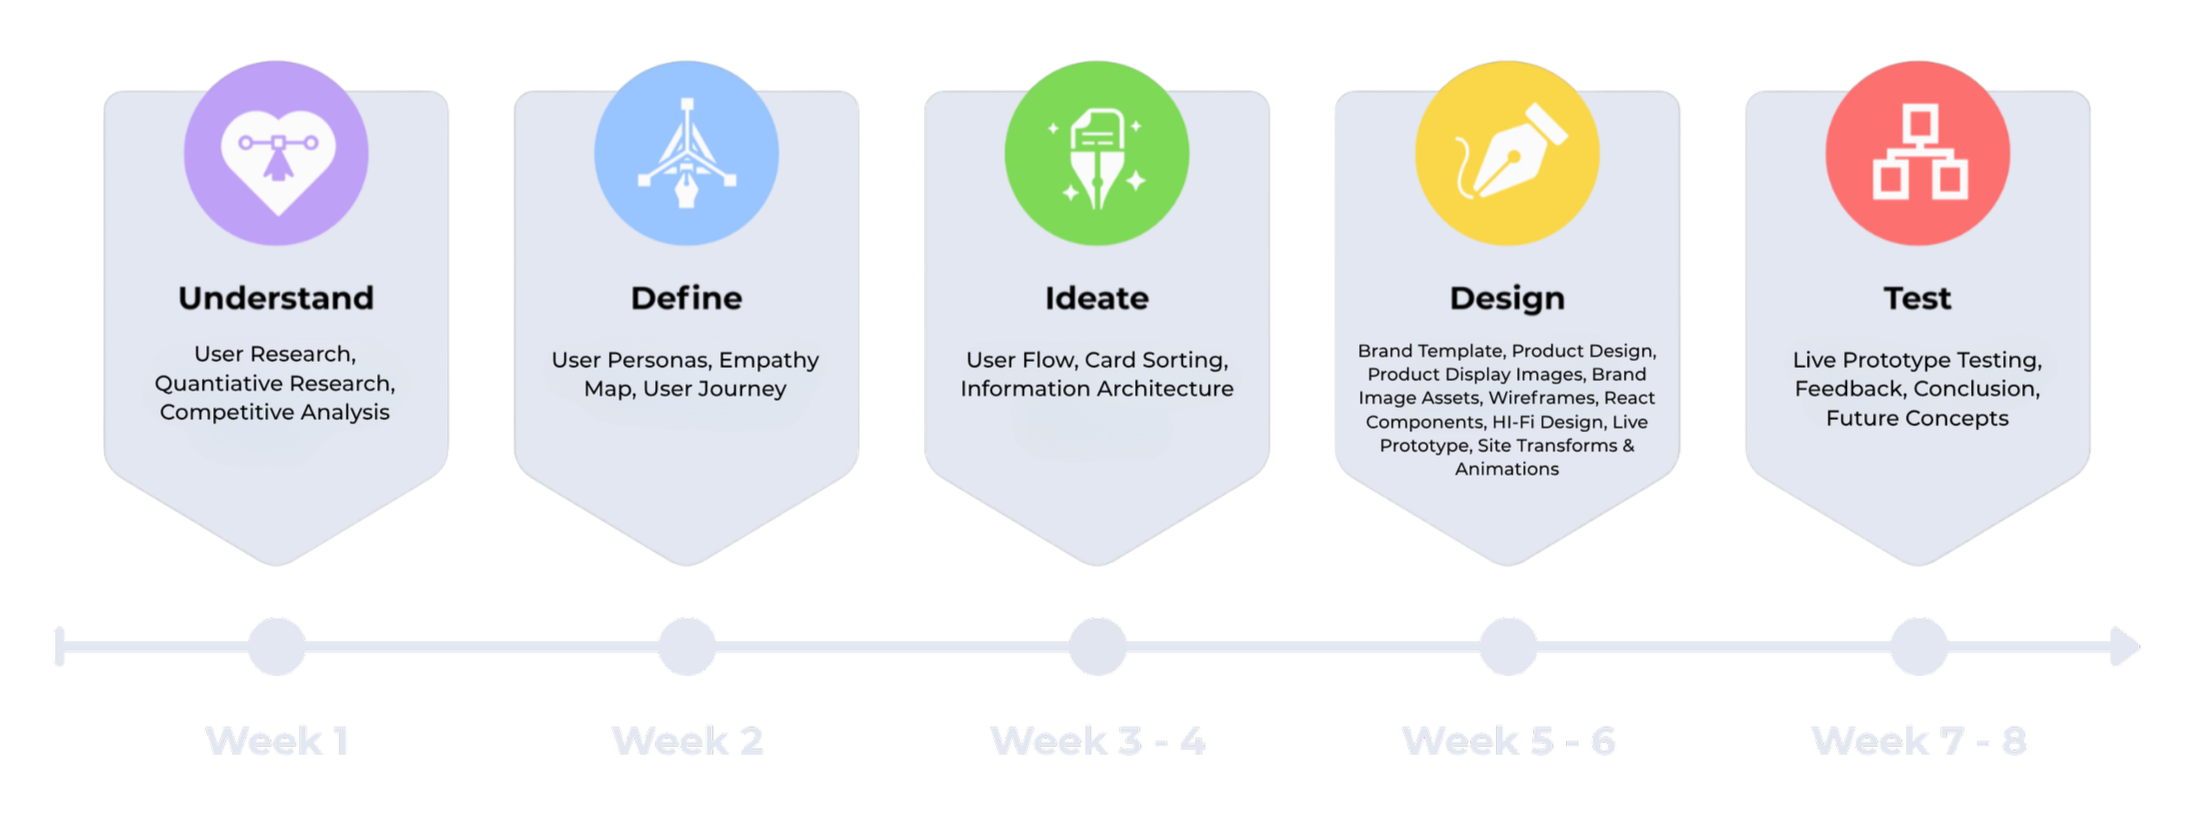
Design Process
—
The design process began with conducting user research, quantitative research, and a competitive analysis to understand the key performance indicators of a good e-commerce product, identify best practices within the industry I was designing the product for, and to identify the aesthetic tastes, values, and location of my user base.
From there, I created a user persona for my primary audience, an empathy map, and her ideal user journey. During this stage I made sure to make note of potential pain points my user could run into which would cause transaction friction or site/cart abandonment. This helped to inform and optimize my card sorting and overall information architecture.
The first stage in my ‘design’ phase was to use my marketing skills to create a built-out brand template for my imaginary company and design a line of imaginary products utilizing said template. From there, I created high-quality brand image assets and product display images to utilize on my site. To create my logos and brand template I used Adobe Illustrator and InDesign, to create my branded product mockups I used Adobe Photoshop, Illustrator and Canva, and to create my high-quality brand assets and product display images I used Adobe Illustrator and Canva.
From there, I created my page wireframes, my interactive components, and my high-fidelity live page prototypes. I created my wireframes and site prototypes using Figma and my knowledge of HTML, CSS, and JS. My interactive components are all written in React. I utilized Figma Make and LeetCode to test and edit my original components to improve loading times and usability.
Finally, in the testing phase, I ran through my prototypes, using my test results to reduce friction and improve navigation and usability.
Design Timeline
—
Quantitative Research
Statistics & Key Performance Indicators for Successful E-Commerce Design
—
Task Completion Rate:
Also referred to as ‘navigation success’, an e-commerce product’s task completion rate is usually measured by its ability to guide users to their desired page without resorting to the search bar. An ideal task completion rate is at or above 85% for finding standard products. (Dynamic Yield, 2026)
Bounce Rate:
This is the percentage of users who leave your site from their landing page, and is often defined as an unengaged session lasting less than 10 seconds with no clicks, scrolls, or conversions. (Semrush, 2026) The current bounce rate for e-commerce sites in 2026 is between 45-55%, with a rate under 45% considered ‘ideal’ (Dynamic Yield, 2026). A high bounce rate for an e-commerce site could indicate pain points such as slow page loading, an unengaging hero section, an unclear call-to-action, or poor mobile optimization.
Conversion Rate:
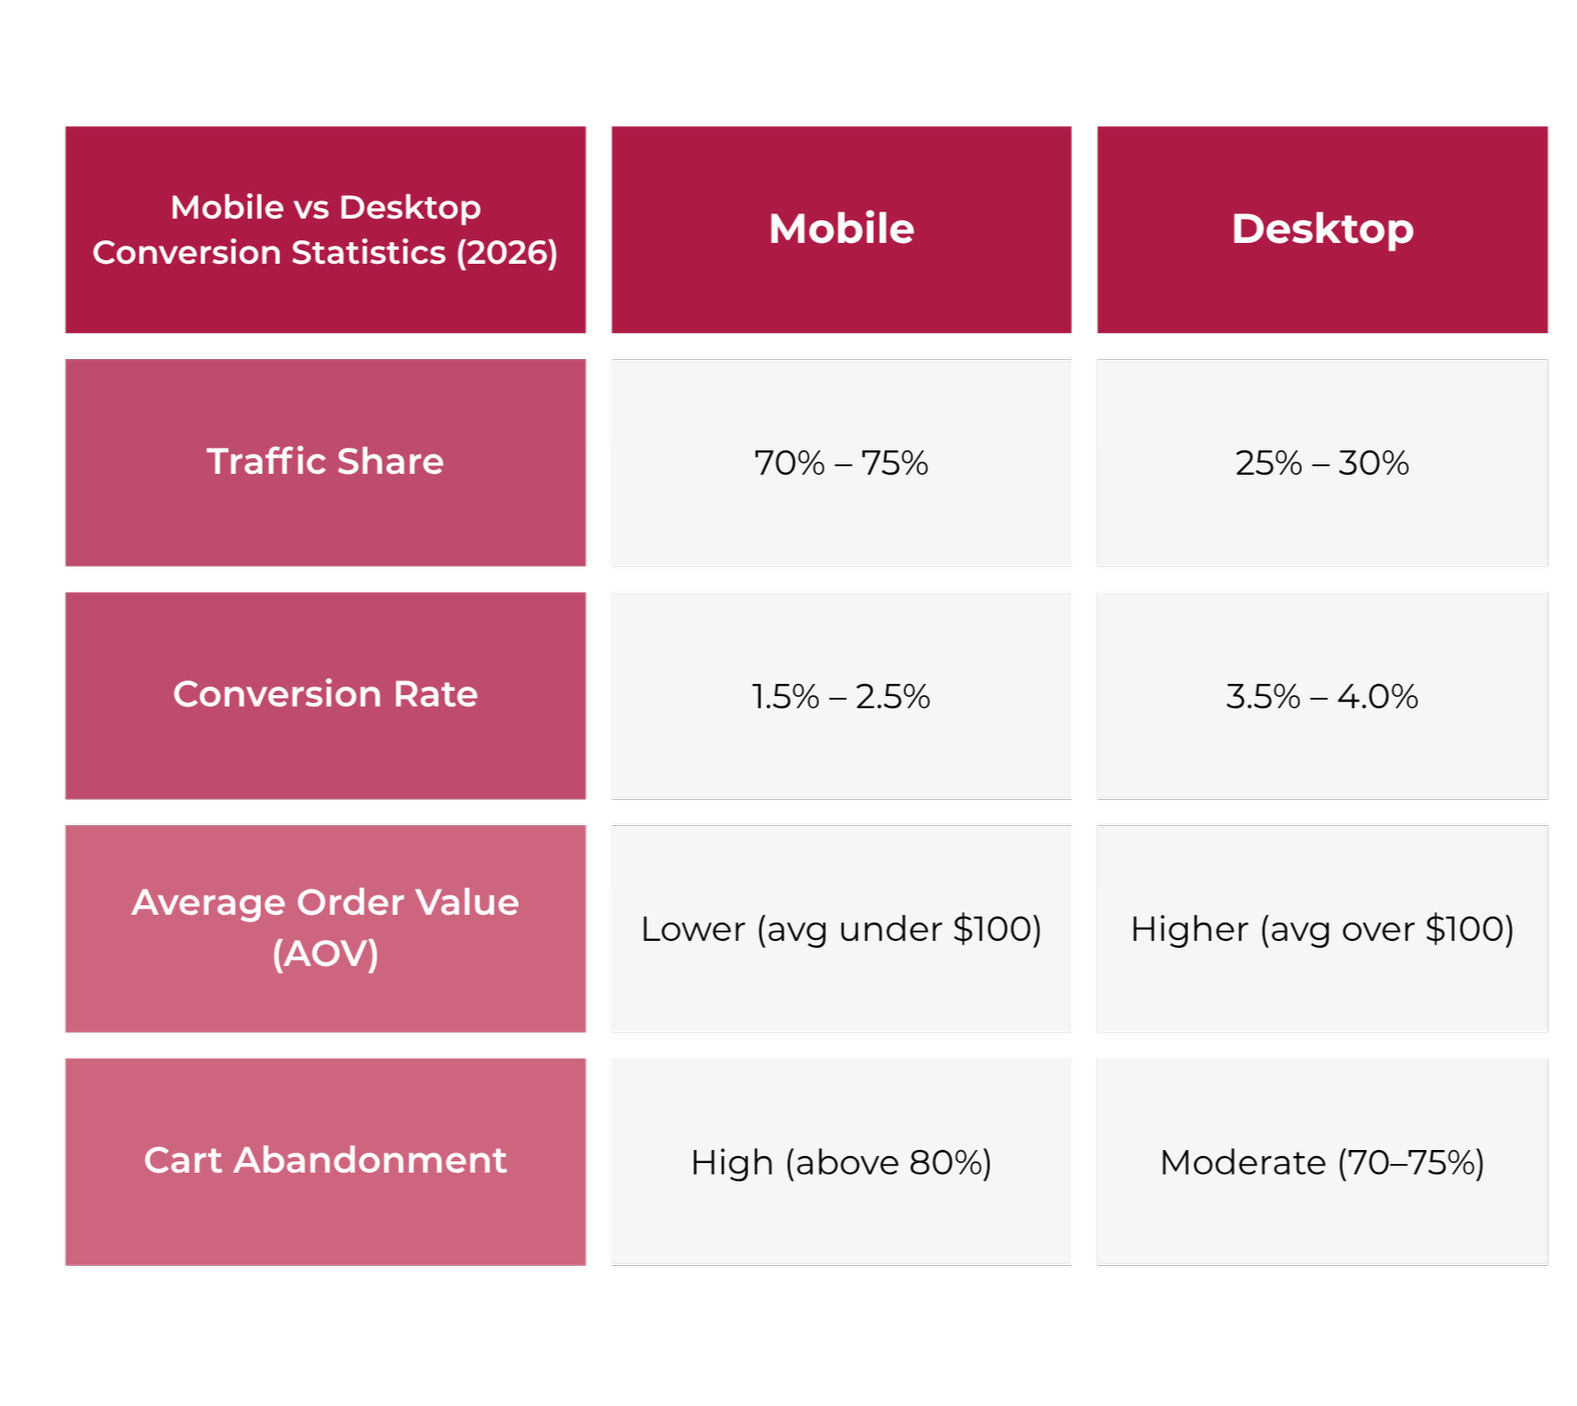
This metric identifies the percentage of sessions that complete the desired action of making a purchase. This is calculated as (Number of Sales ÷ Total Visitors/Sessions) × 100, and an ideal conversion rate is around 3-4% for Desktop, and 2-3% for mobile. (Dynamic Yield, 2026)
Mobile vs Desktop Traffic:
For an e-commerce page, the average ratio is around 70-75% mobile traffic and 25-30% desktop traffic. (Statista Market Insights, 2026) This highlights why a good mobile optimization is so important, though it is important to note that desktop users spend more on average and have a higher conversion rate. (Dynamic Yield, 2026)
Cart Abandonment Rate:
This measures the percentage of failed conversions, specifically, users who add items to their shopping cart but leave the website without completing the purchase. The e-commerce average is around 70%, with a sub-65% considered ideal. (Statista Market Insights, 2026) This is a helpful metric because it can help to identify potential pain points that might be causing conversions to fail, like a lengthy checkout process, security concerns, or hidden fees displayed at the last minute.
Sources Cited: Dynamic Yield (2026)
Target Audience
Core Demographics: Gen Z and Millennial Women
Ages: 18–24, 25–35
Psychographics: Female Gen Z and Millennial users are known to be highly digital, value-driven, and conscious consumers, who appreciate authenticity, transparency, and community. Both of these audiences are likely to assign more weight to social proof when making purchasing decisions. (Deloitte, 2024)
Values: Community, authenticity, mental well-being, environmental sustainability, inclusivity, and financial transparency. (Deloitte, 2024)
—

—
User Research
Through competitive analysis, quantitative and user research, I identified industry practices, key motivations, pain points, behaviors, and goals that shape the user’s e-commerce experience.
—
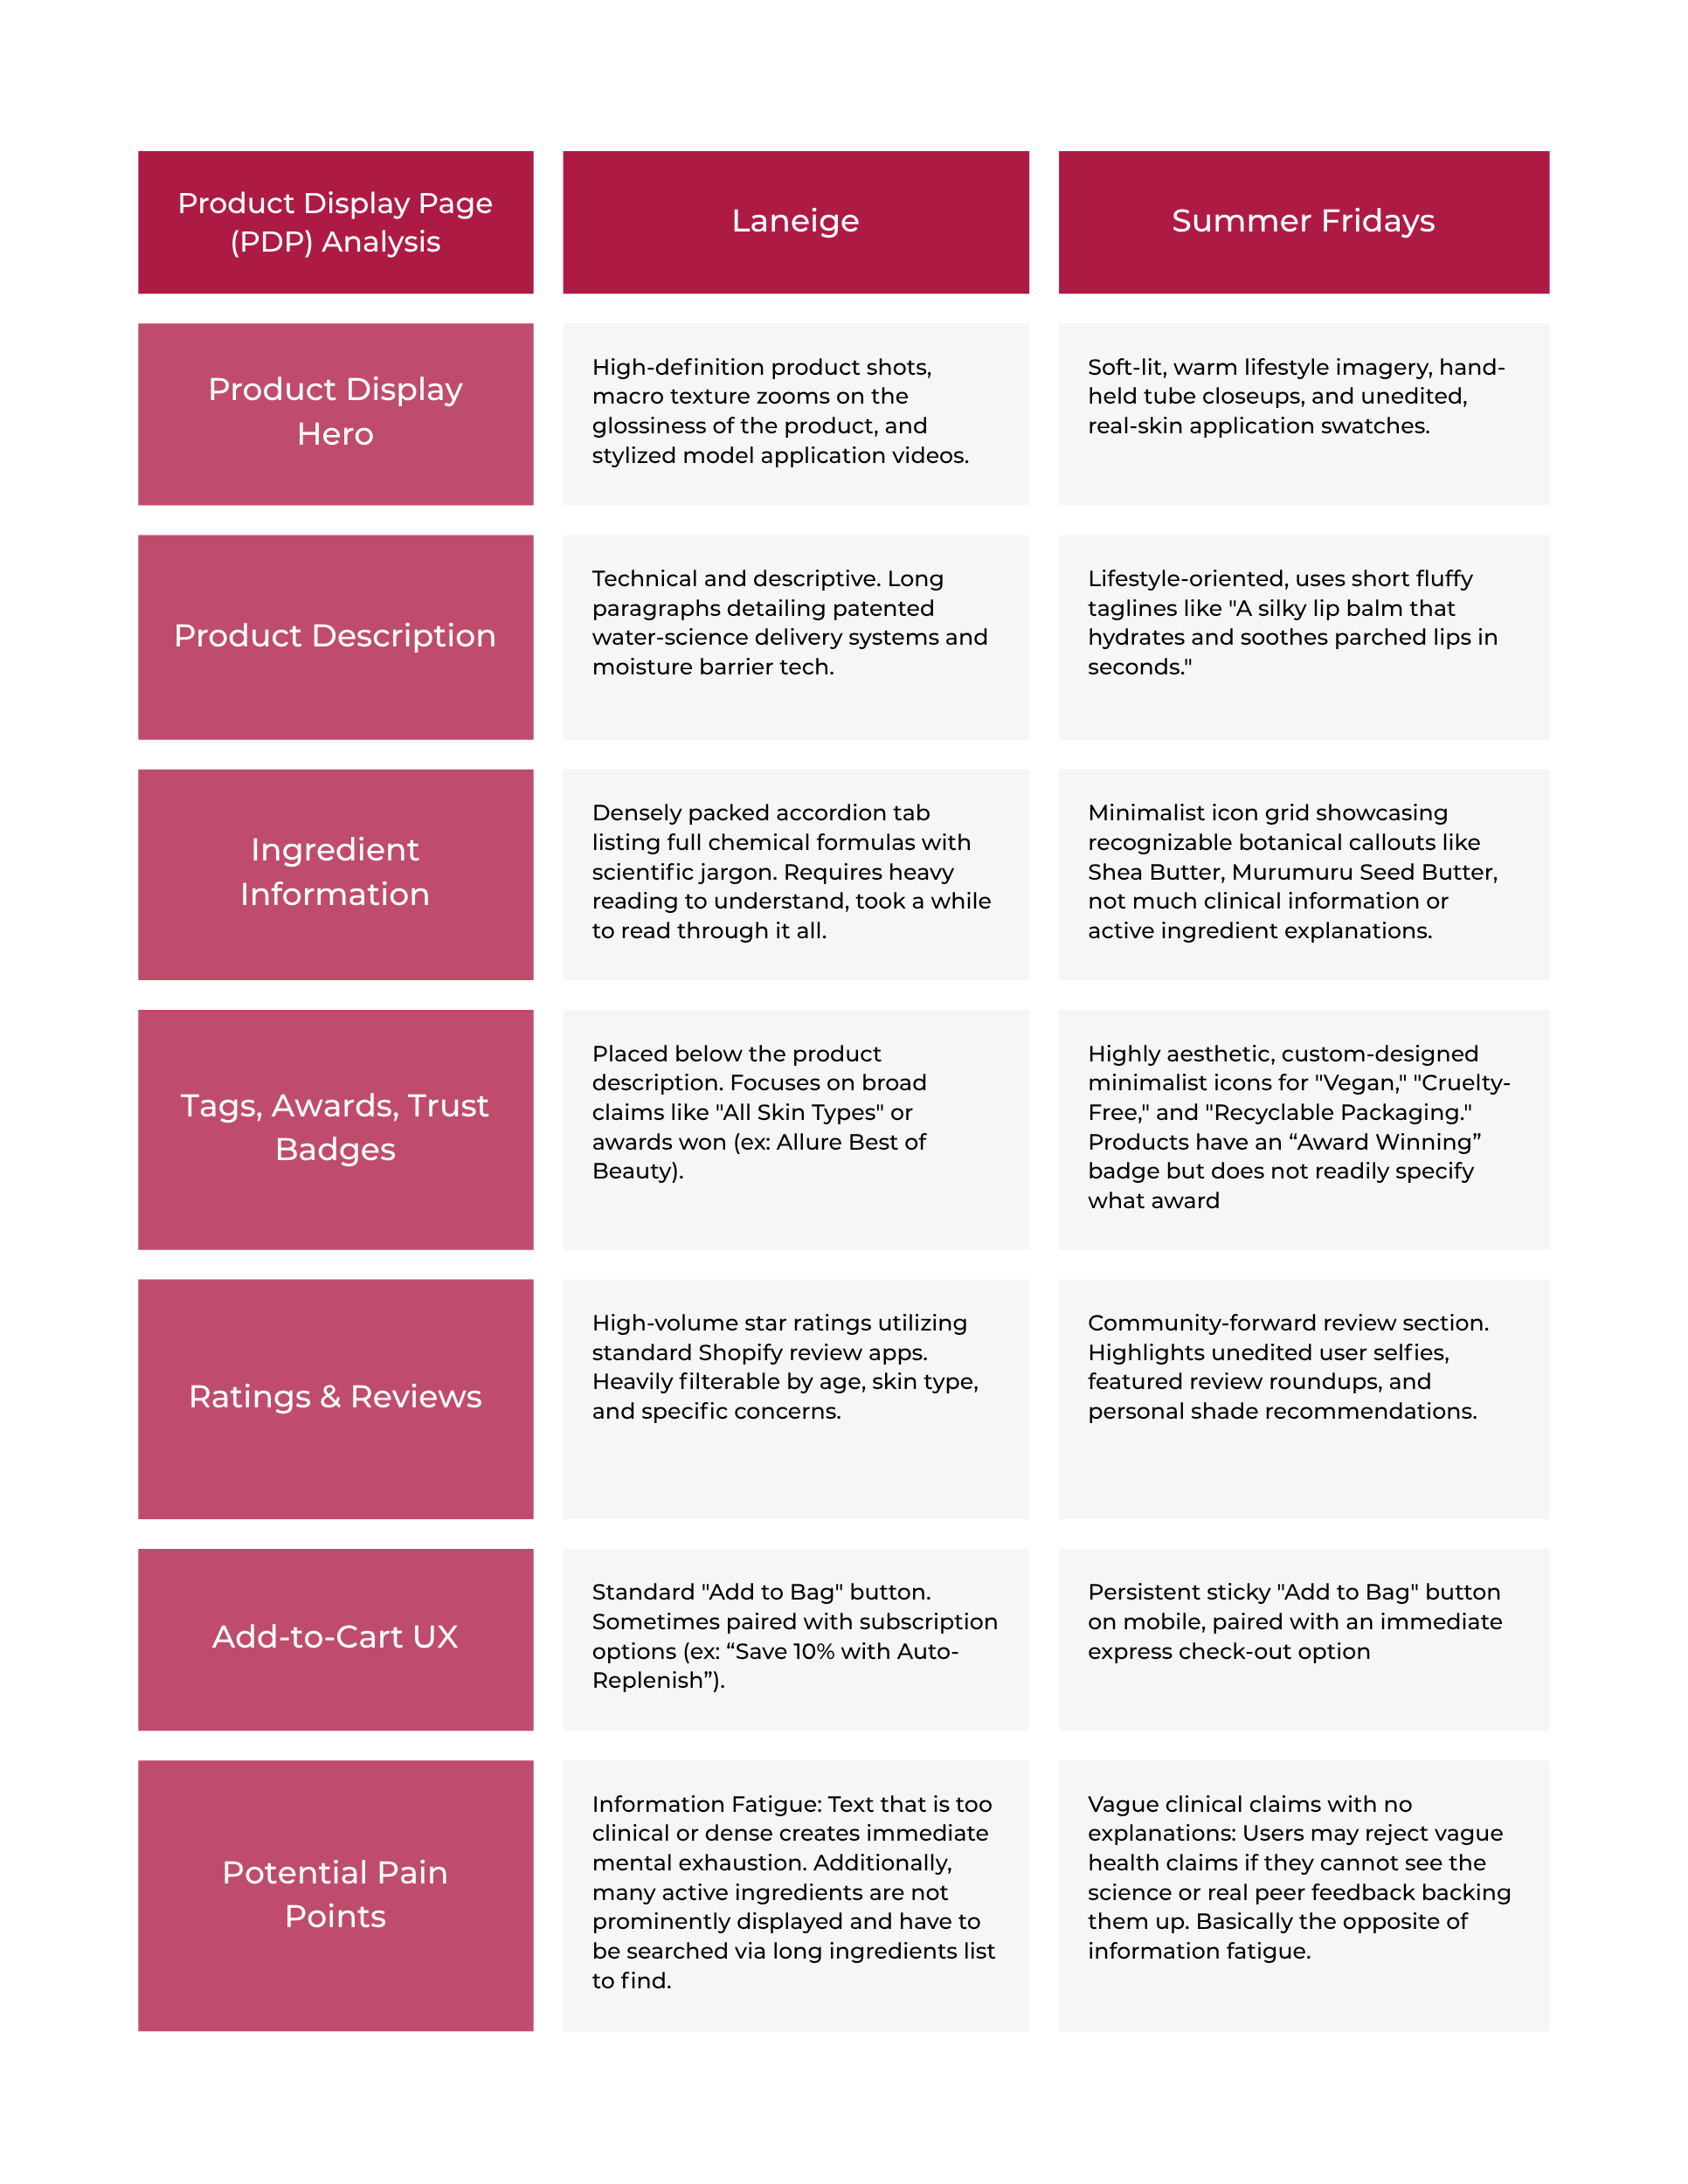
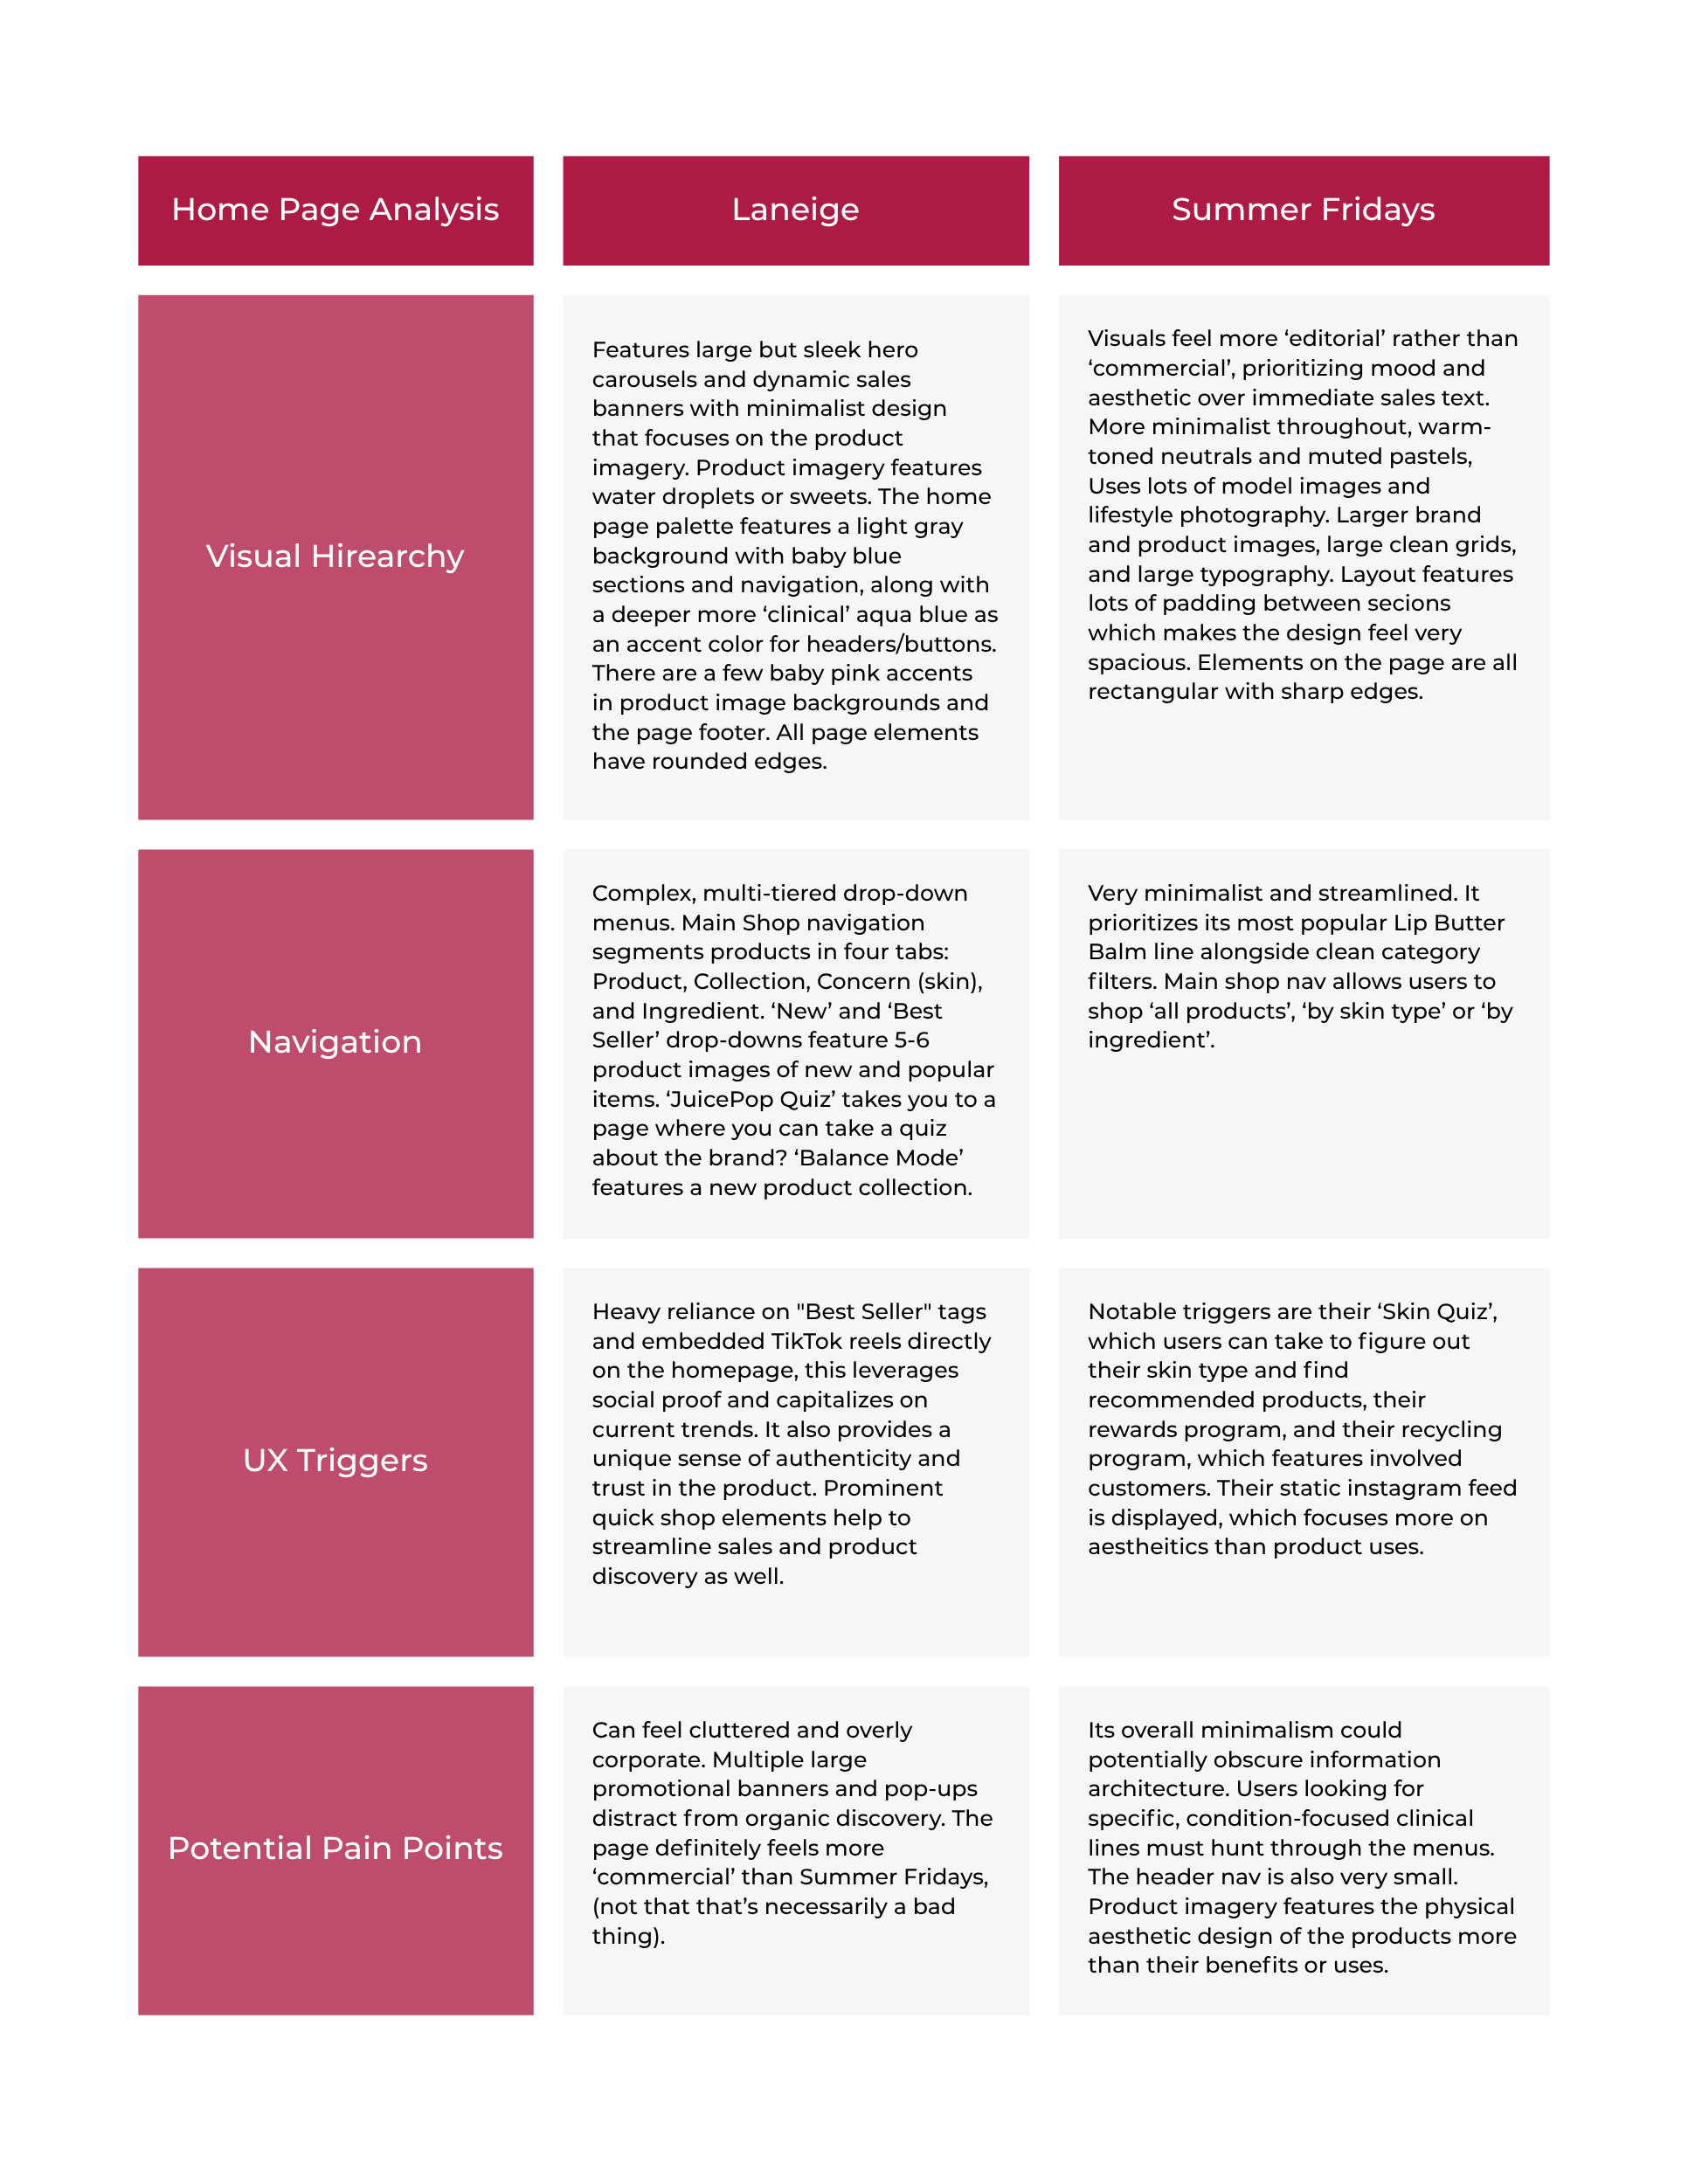
Competitive Analysis
The competitive analysis focused on reviewing two leaders in the skincare & beauty industry with similar star products to identify strengths, weaknesses, industry standards, and potential pain points.
About Laneige:
Laneige is a premium South Korean skincare brand launched in 1994. The brand positions itself around "Water Science," focusing on skin hydration and rejuvenation. Laneige successfully engages Millennial and Gen Z users by pairing clinically validated formulas with aesthetic, colourful product design.
Site Traffic: 600,000 to 650,000 monthly sessions on their primary domain http://laneige.com.
Conversion Rate: Reports a baseline conversion rate between 1.50% – 2.00%.
Average Order Value (AOV): reports averages between $175 – $200 per online transaction.
Demographics: Their reported user base is primarily mobile, 79% female, and mostly in the 25-34 age bracket.
About Summer Fridays:
Summer Fridays is an LA-based skincare and makeup company founded in 2018. Also capturing a large Millennial and Gen Z audience, the brand focuses on simple, vegan, and cruelty-free products designed for self-care and skincare.
Site Traffic: Reports between 550,000 to 600,000 monthly sessions on their primary site summerfridays.com
Conversion Rate: Summer Fridays currently boasts a 3.3% – 3.5% conversion rate.
Average Order Value (AOV): Reports between $100 – $125 per transaction.
Demographics: Their reported user base is 80% female, mobile-first, and also primarily in the 25-34 age bracket.
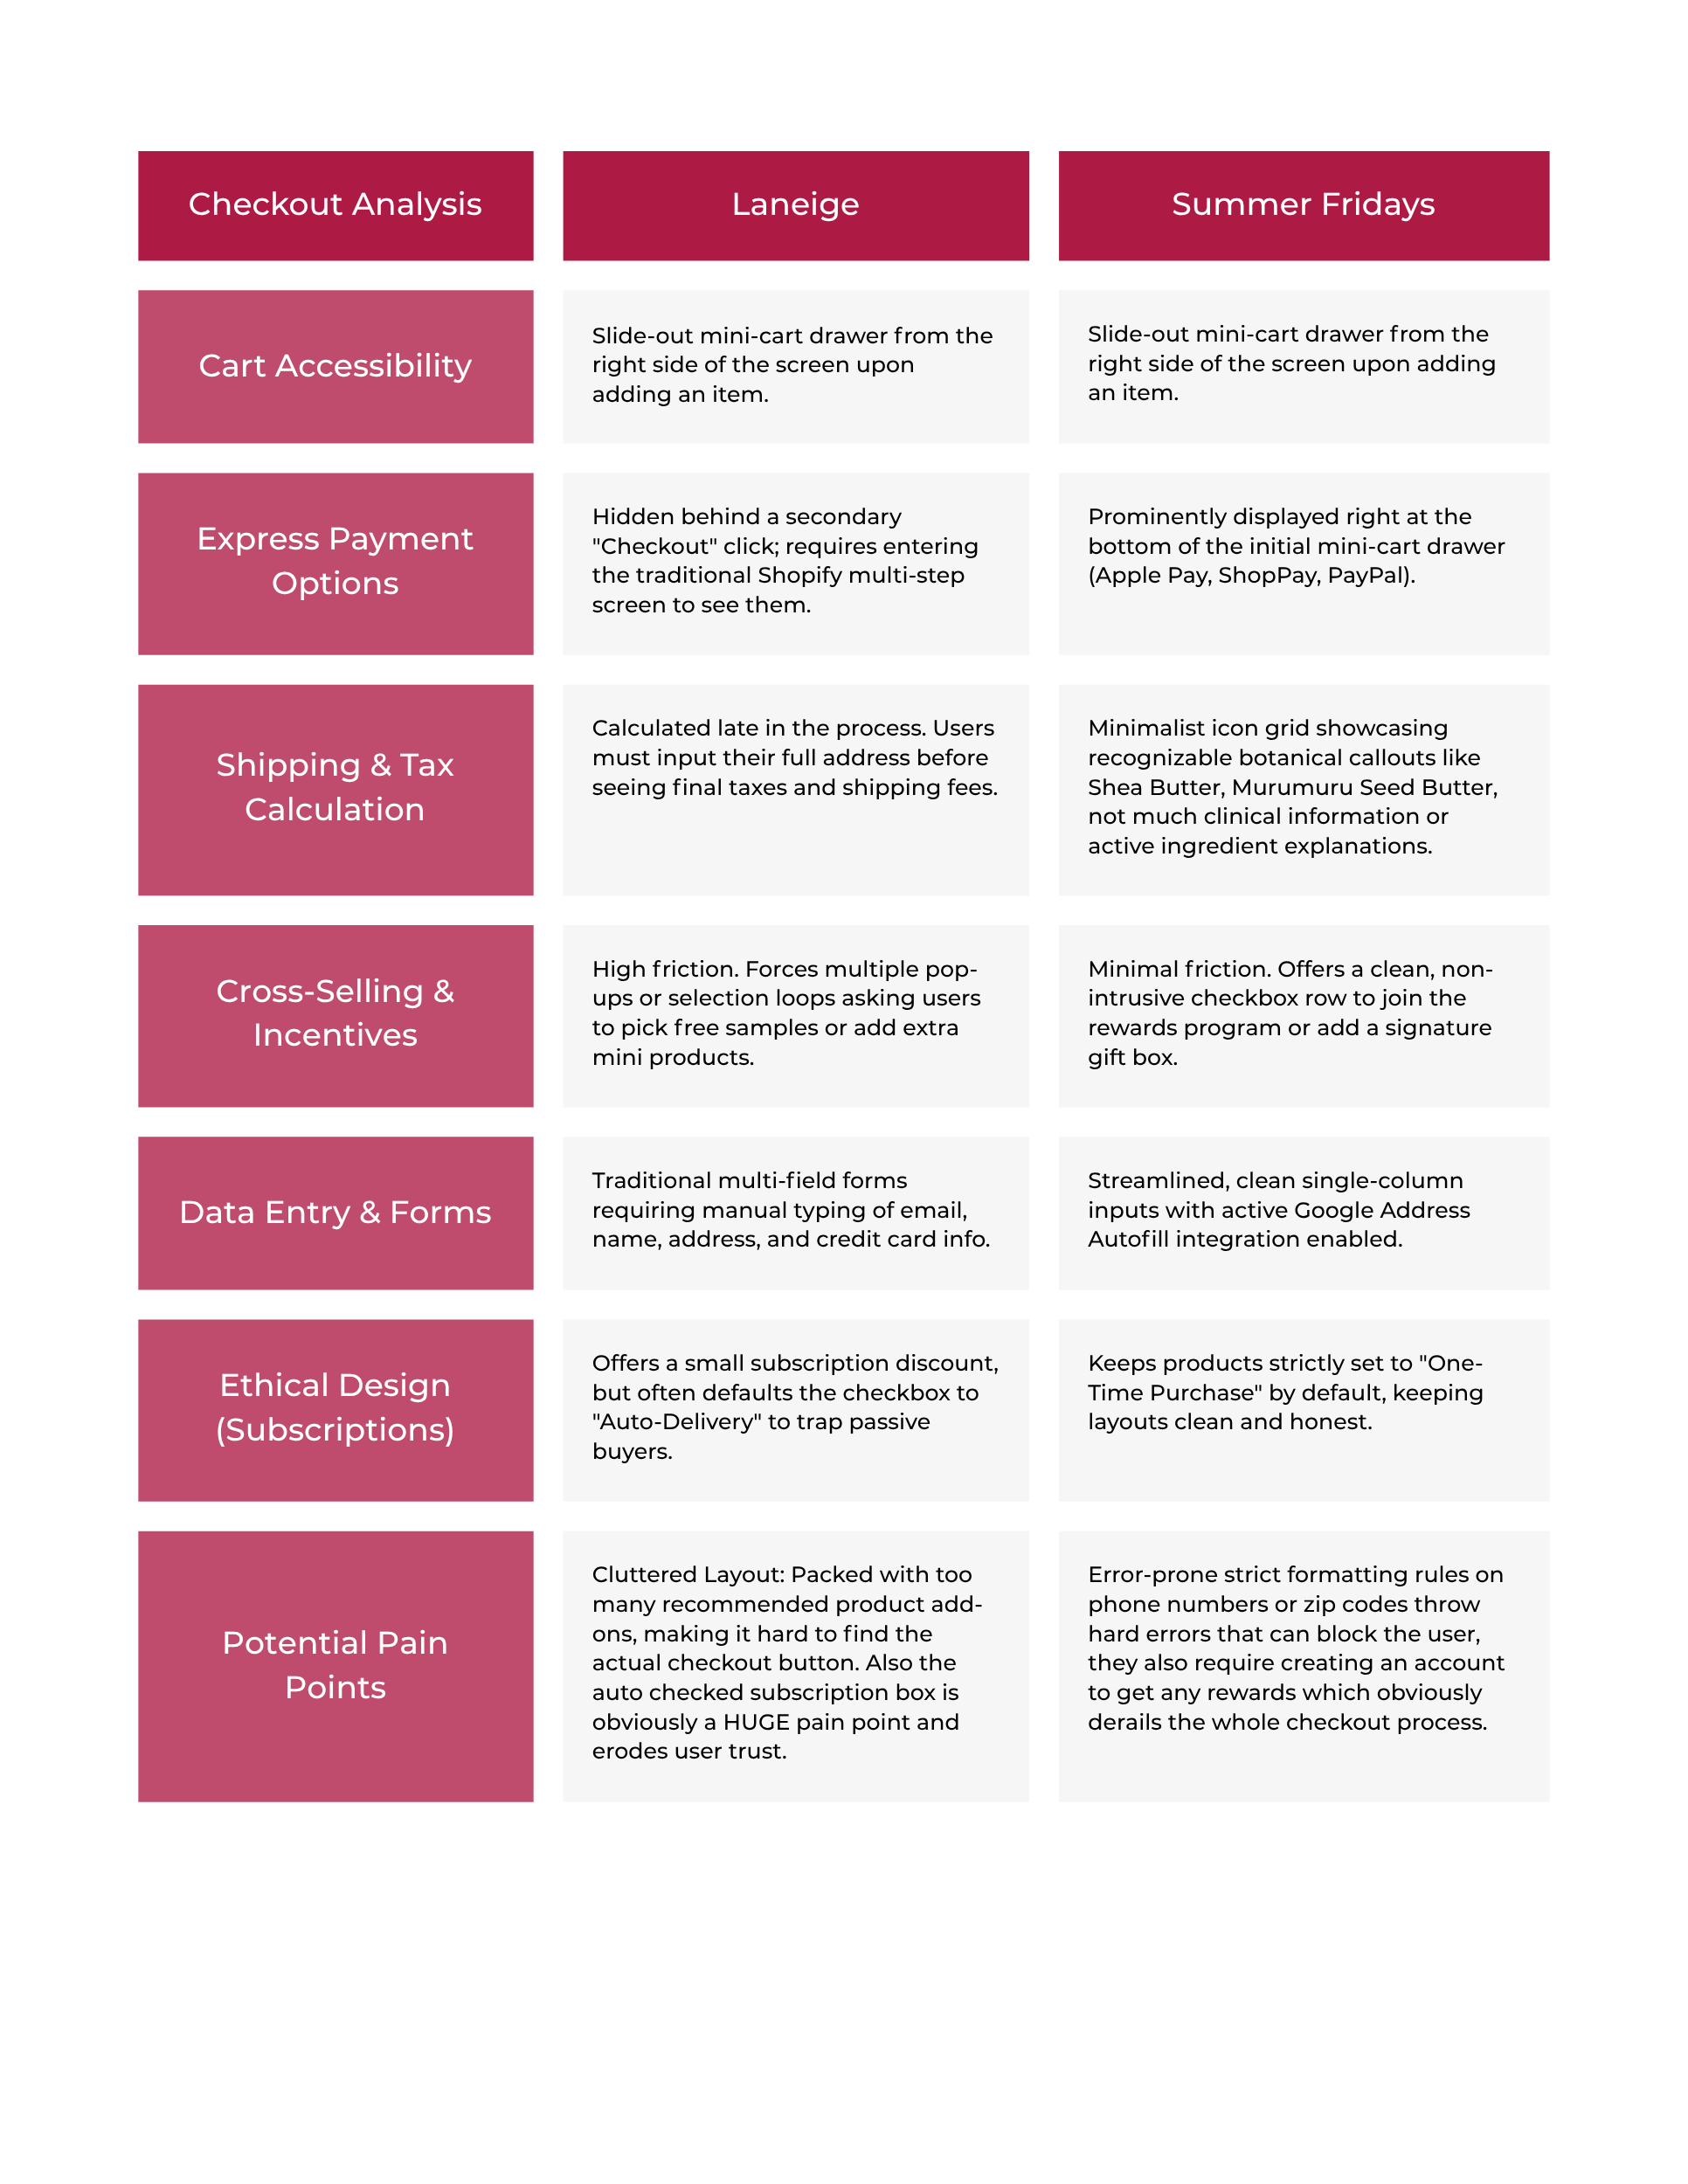
Pain Points

—
#1. The Authenticity Gap
Overly filtered product images and results can cause users, (especially Gen Z) to assume the product or results were photoshopped and undermines trust. Vague clinical claims that are not explained or backed up can also undermine trust.
#2. Information Fatigue
Text that is too clinical or dense for the average user creates friction and mental exhaustion. Not making the active ingredients in the product readily displayed can also cause fatigue as it can force the user to hunt through long paragraphs to find specific ingredients like UV filters.
#3. Checkout Form Fatigue and Last-Minute Fees:
Forcing a mobile shopper to manually type out her shipping address and credit card number on a tiny screen causes instant basket abandonment. Additionally, displaying hidden fees at the last second before completing the purchase is a large driver for cart abandonment.
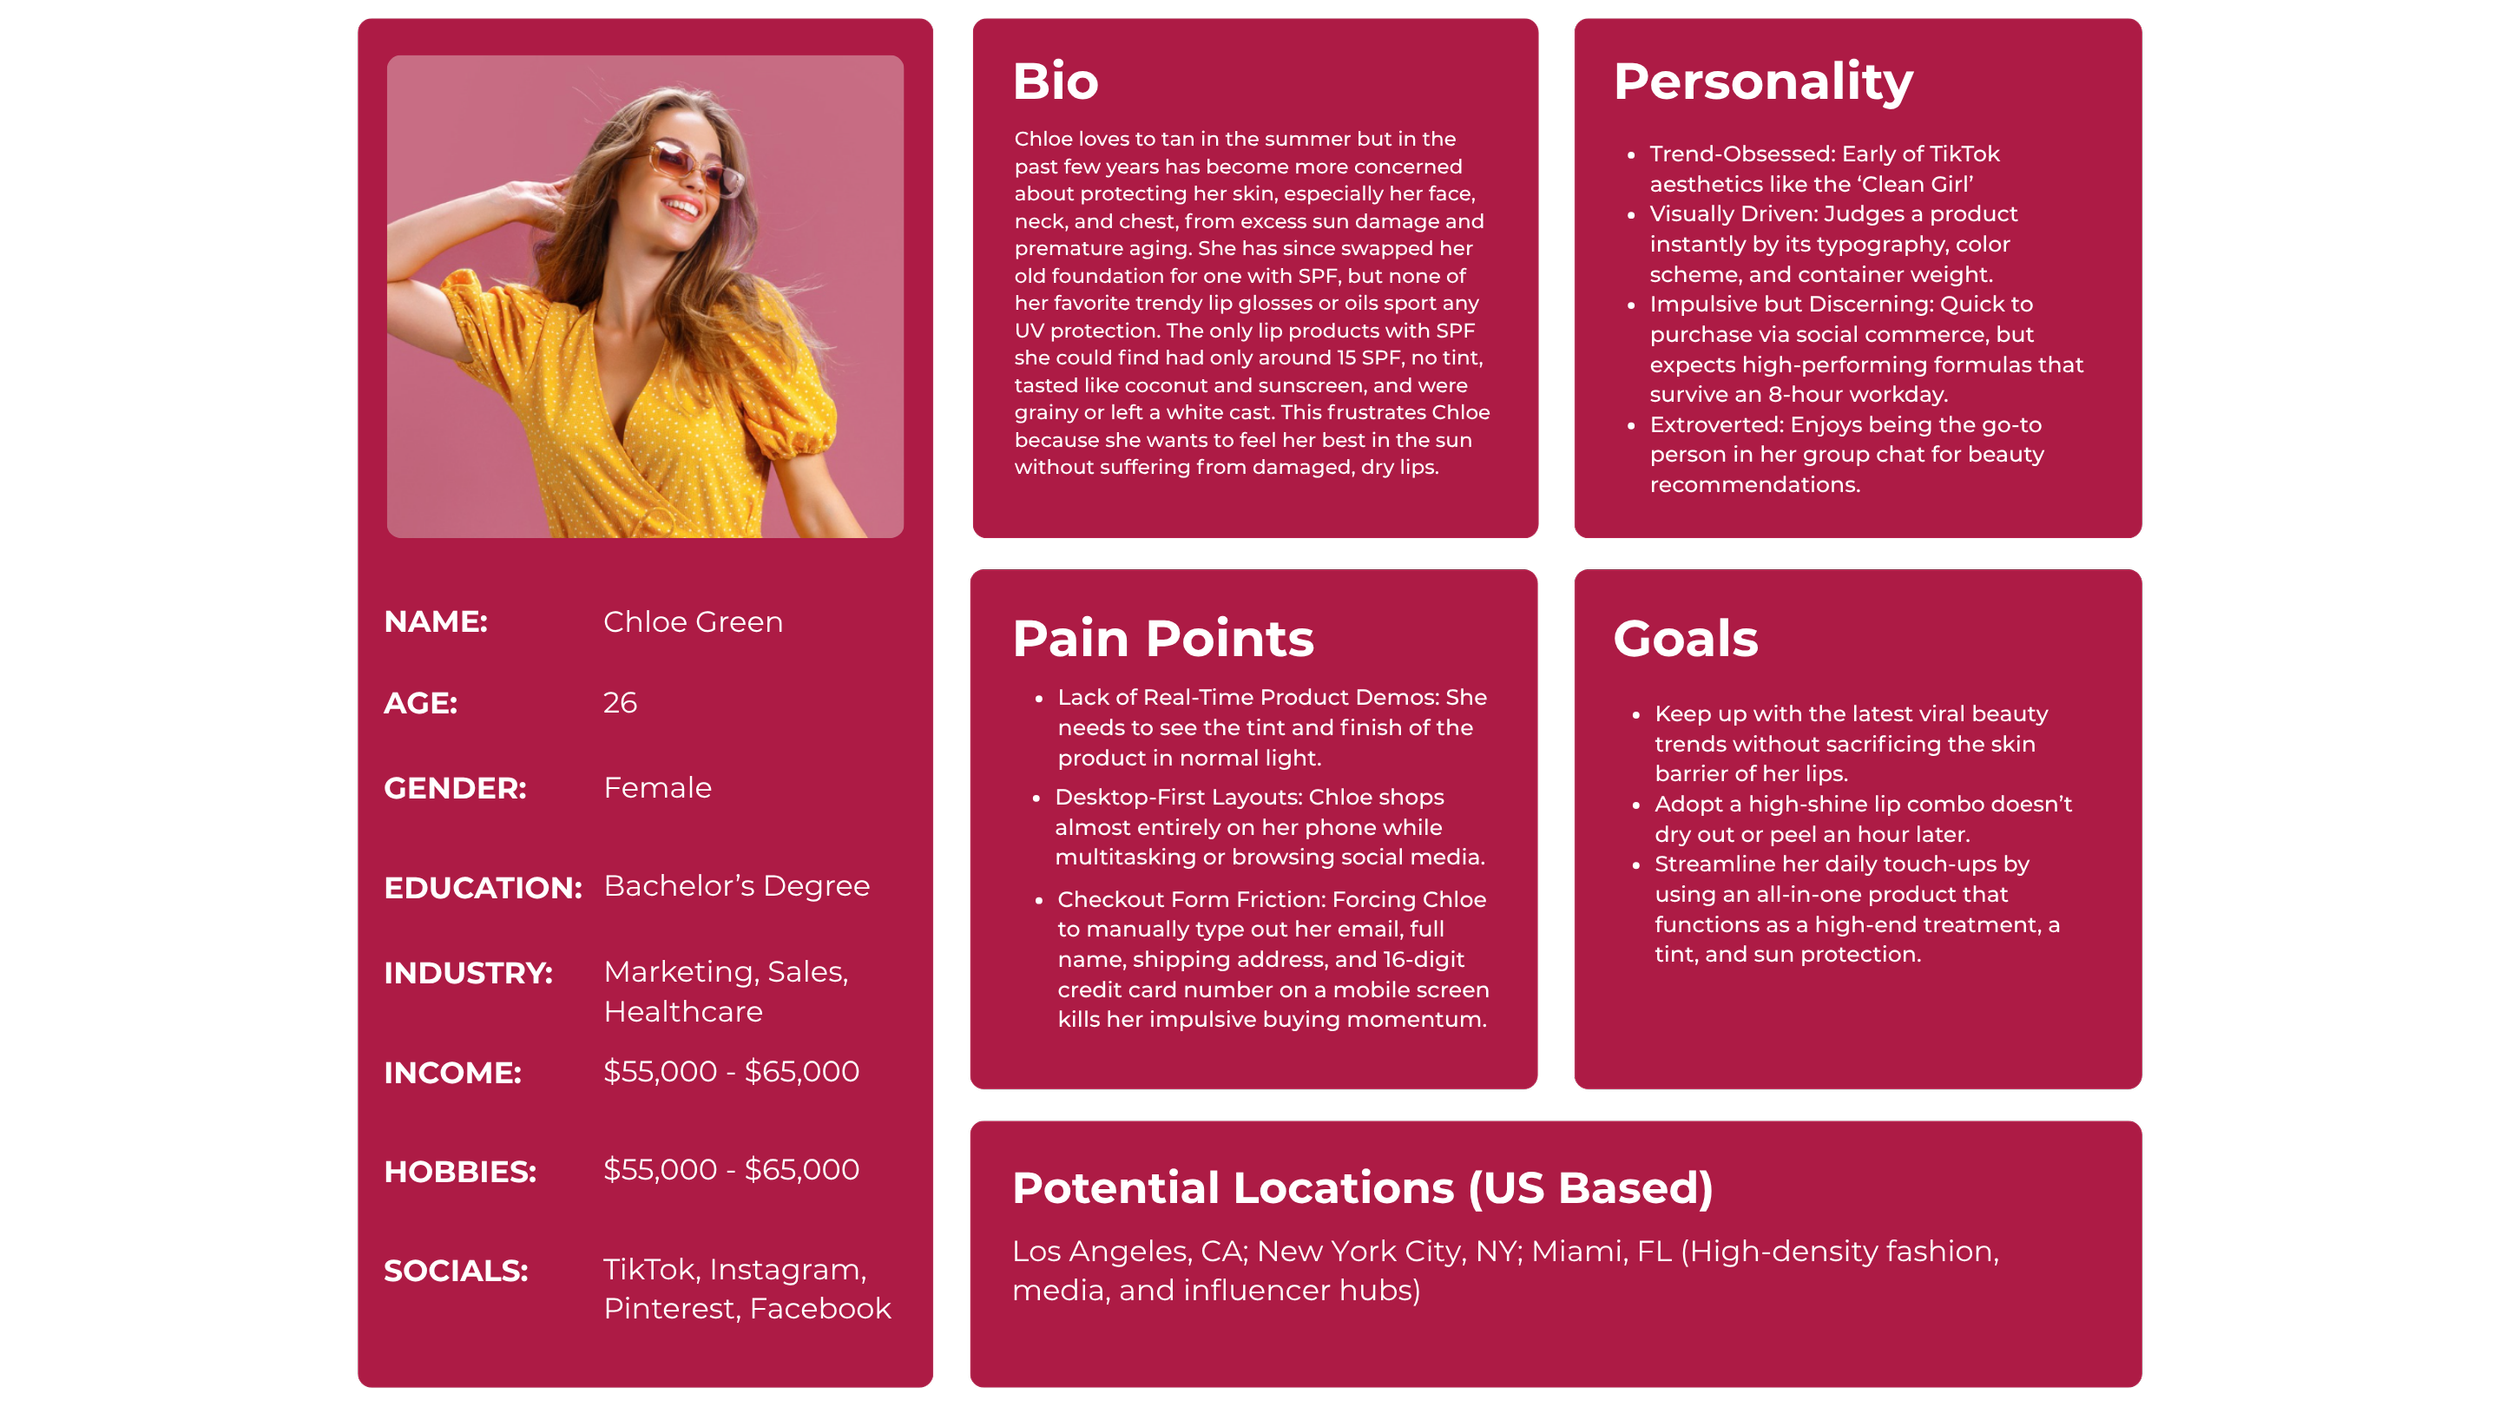
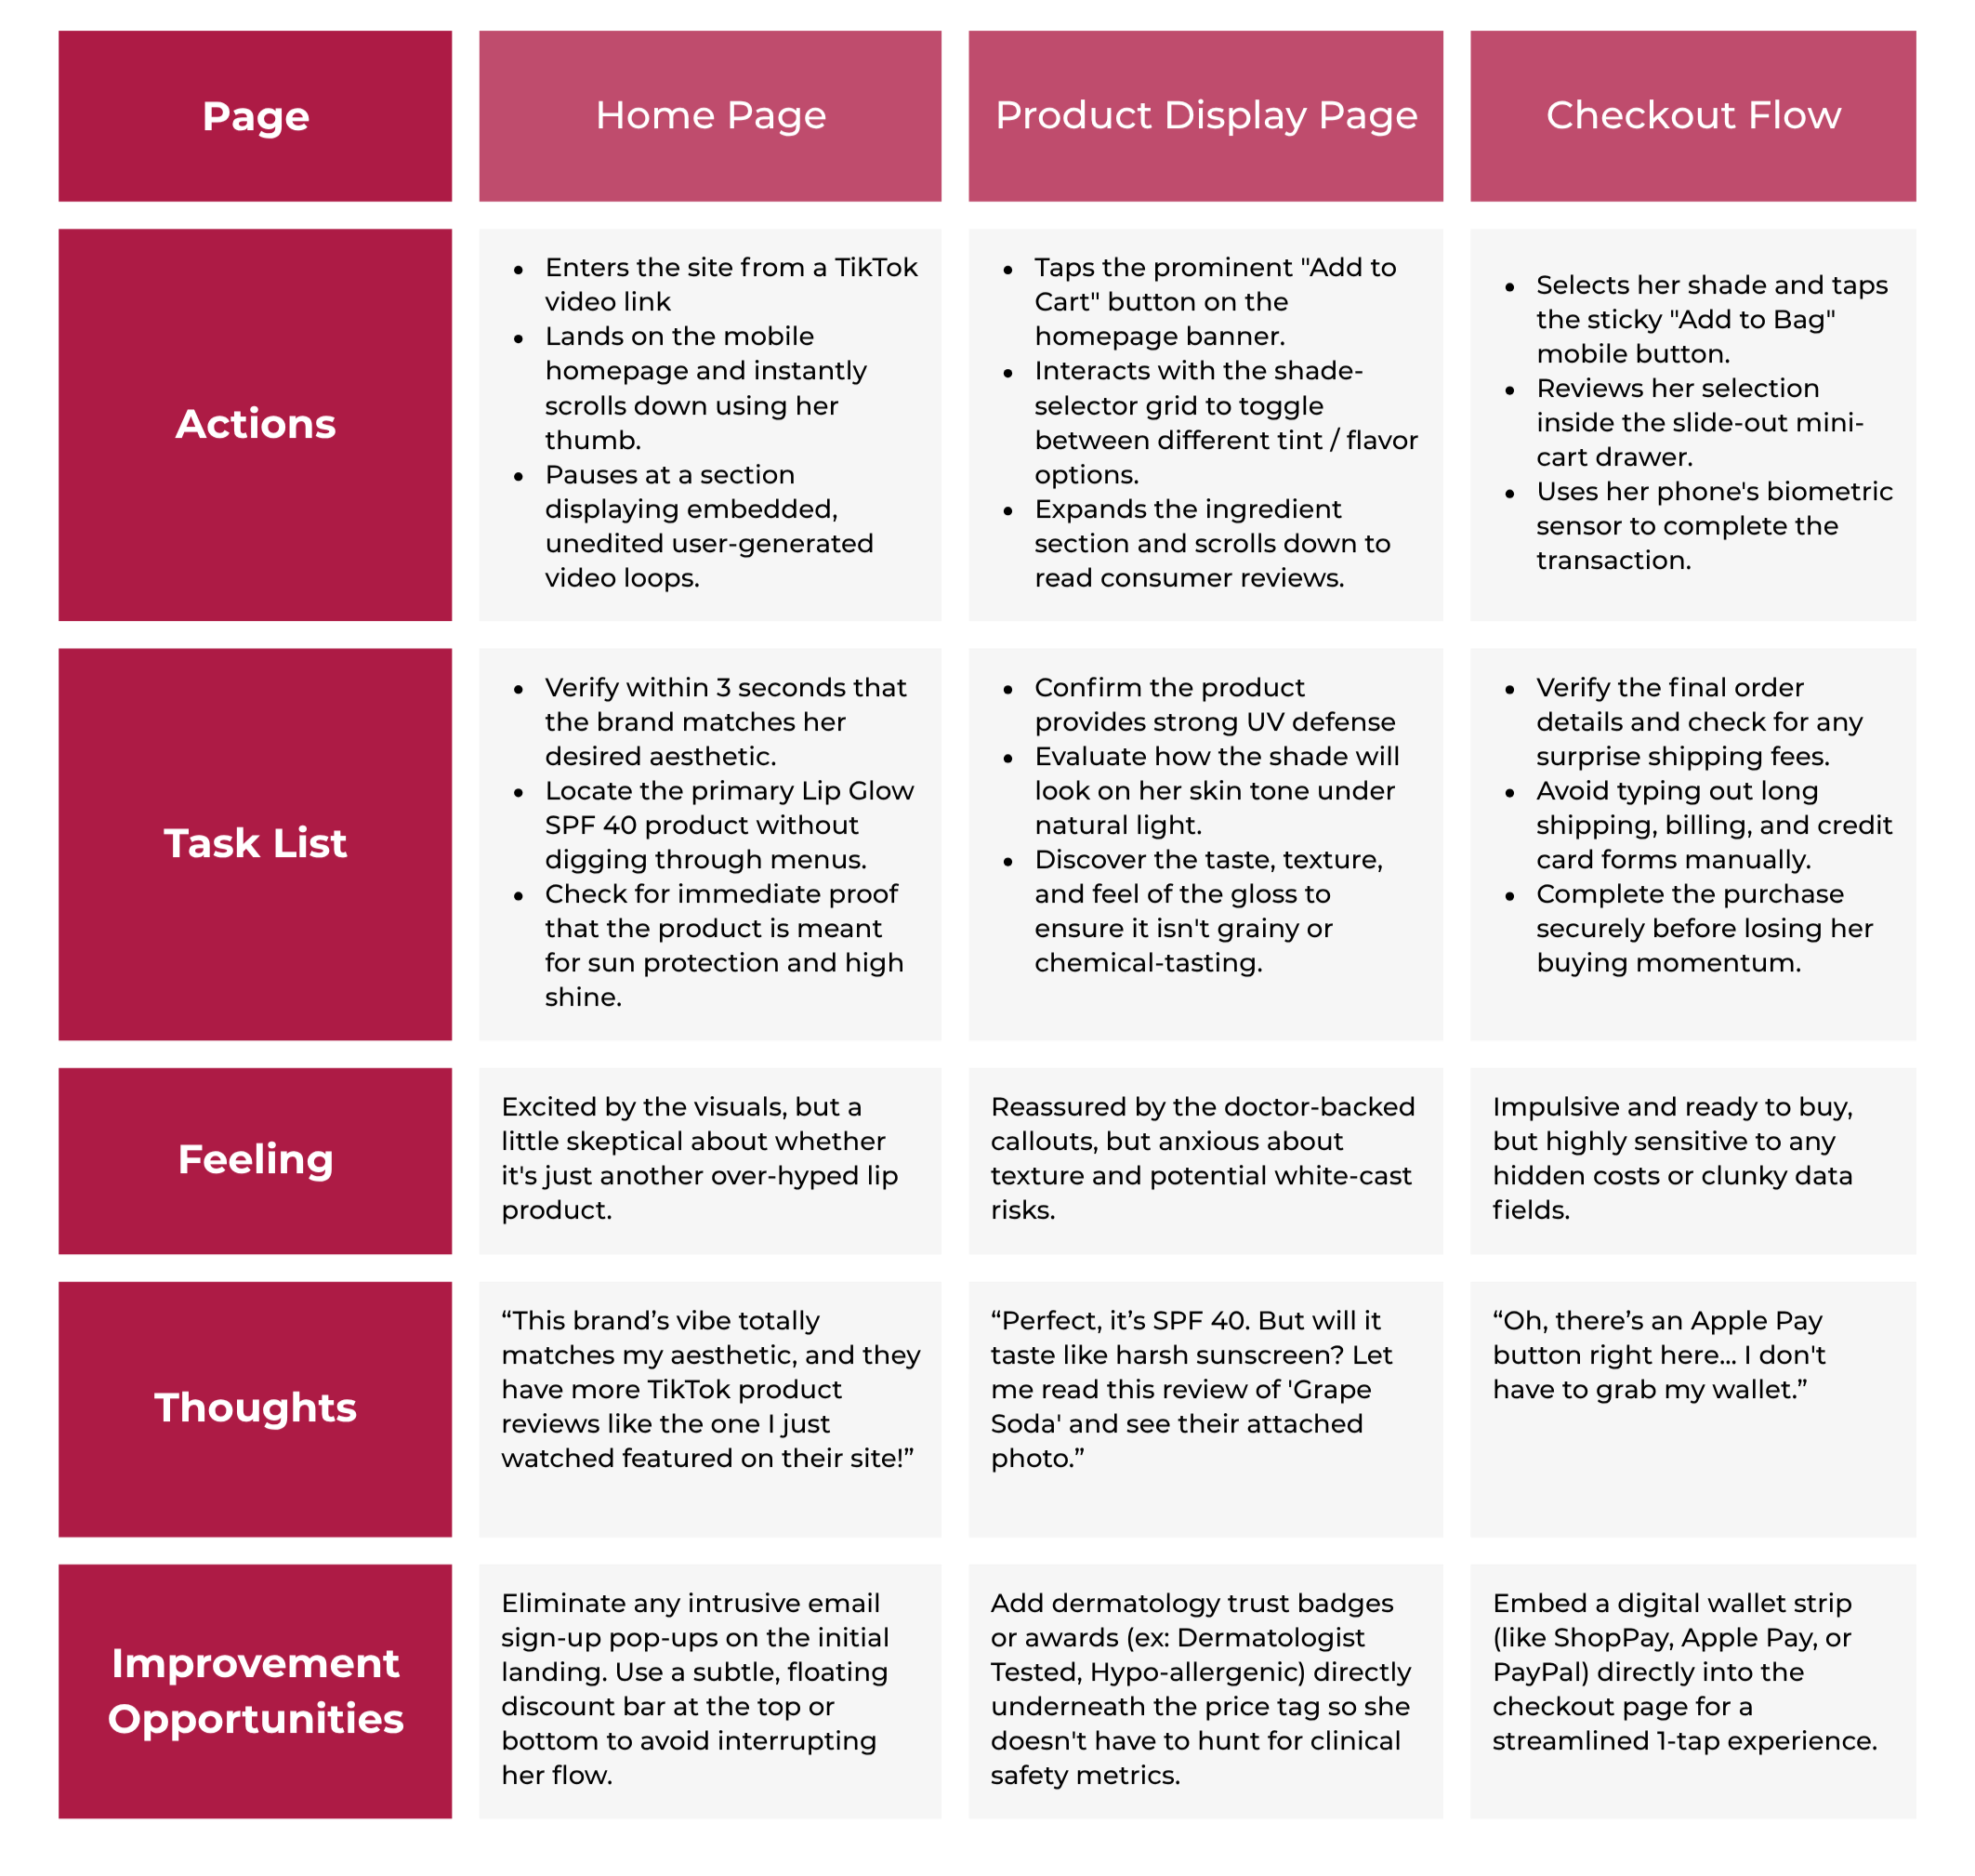
User Persona - Mobile Gen Z User
—
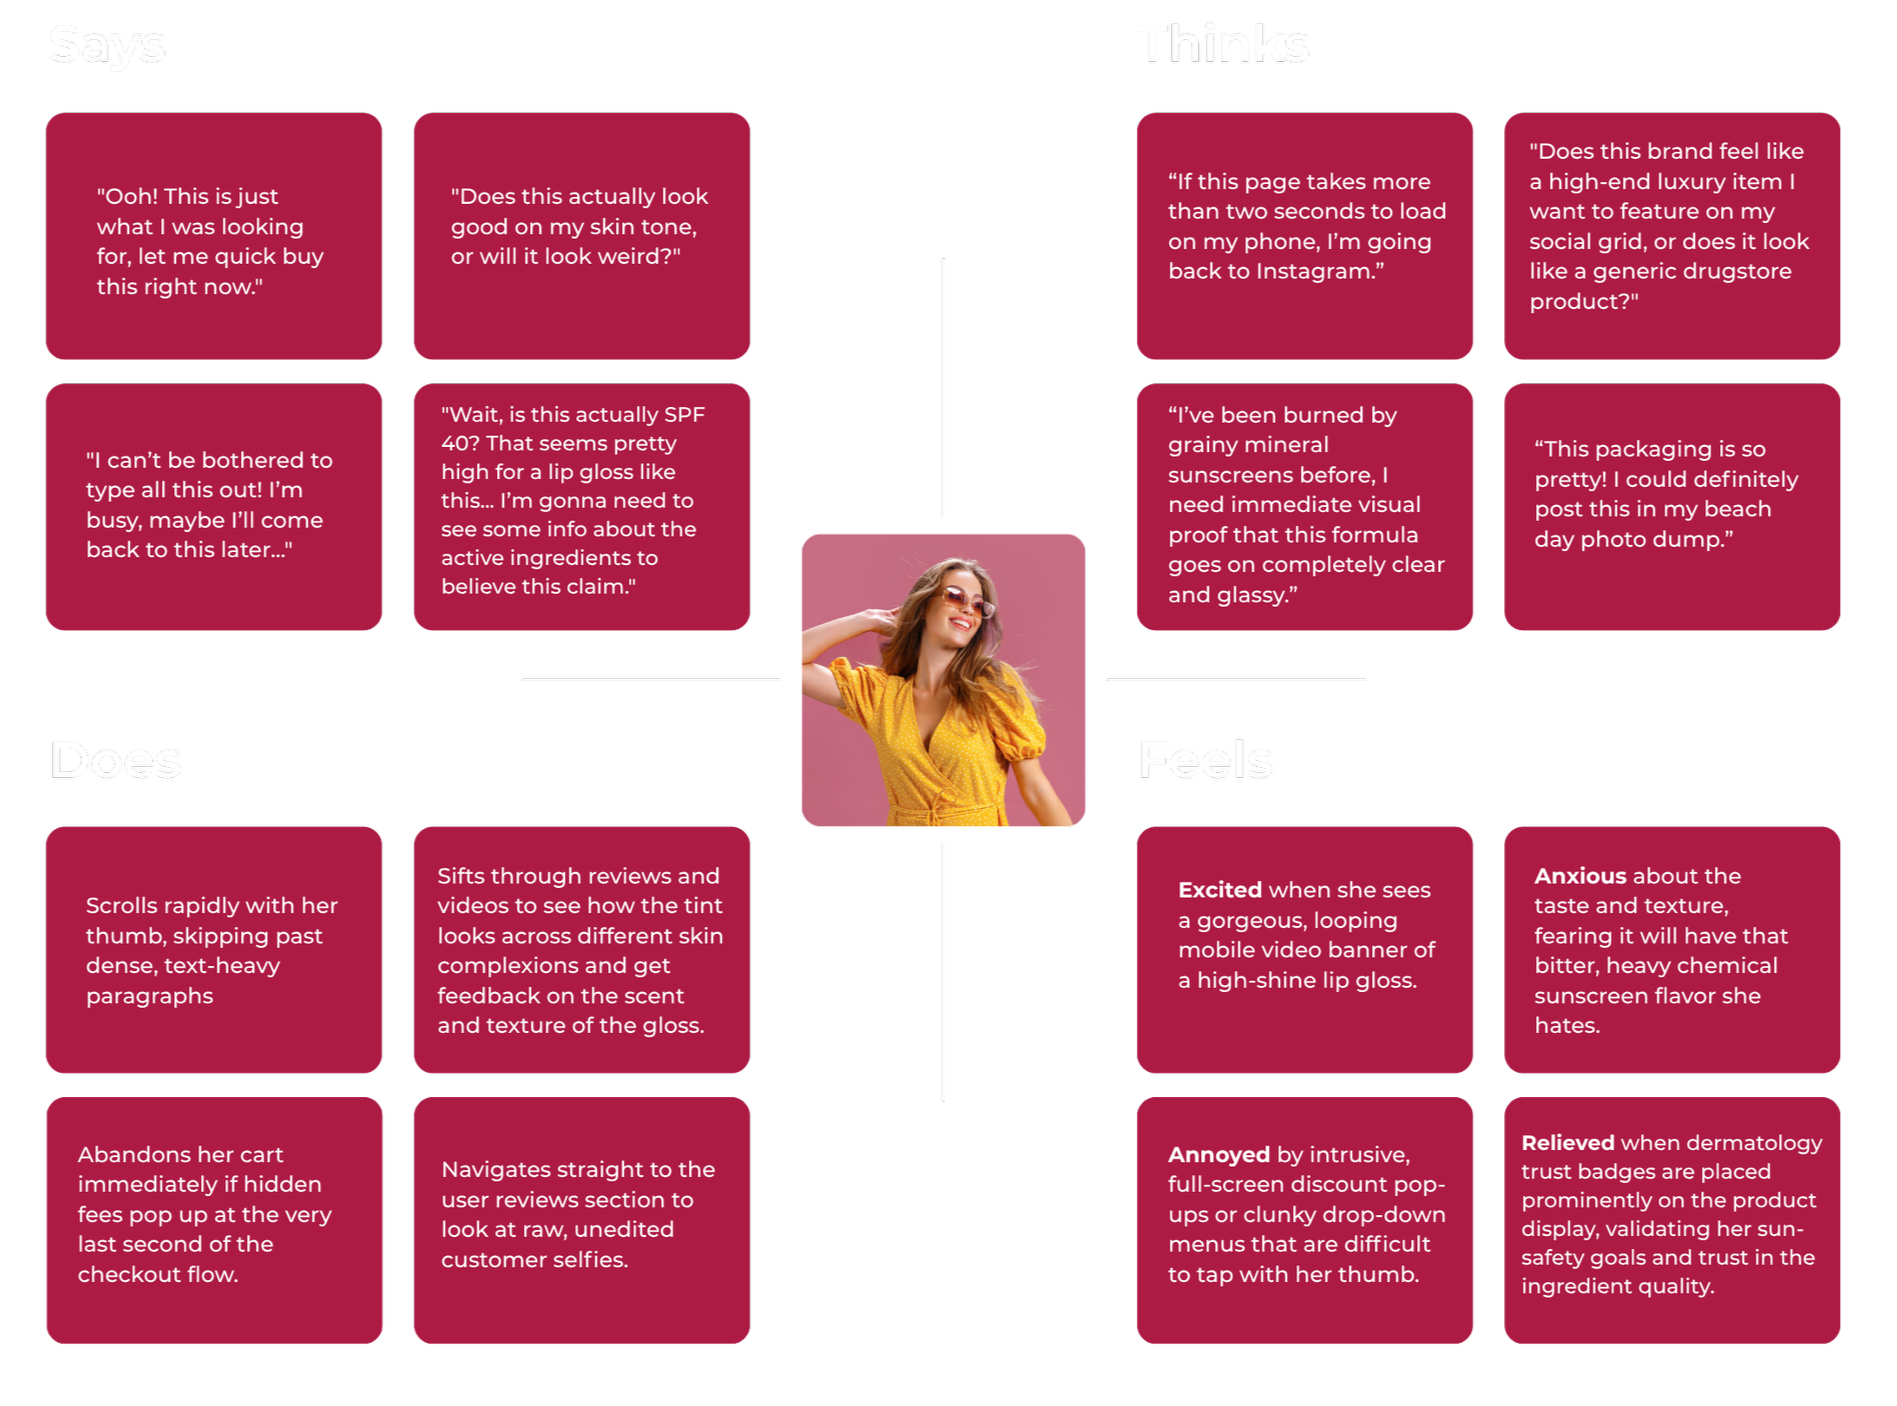
Empathy Map
—
User Journey Map
—
Persona: Mobile Gen Z User
Goal: Discover the site, find an SPF lip gloss that meets her criteria, and complete the purchase.
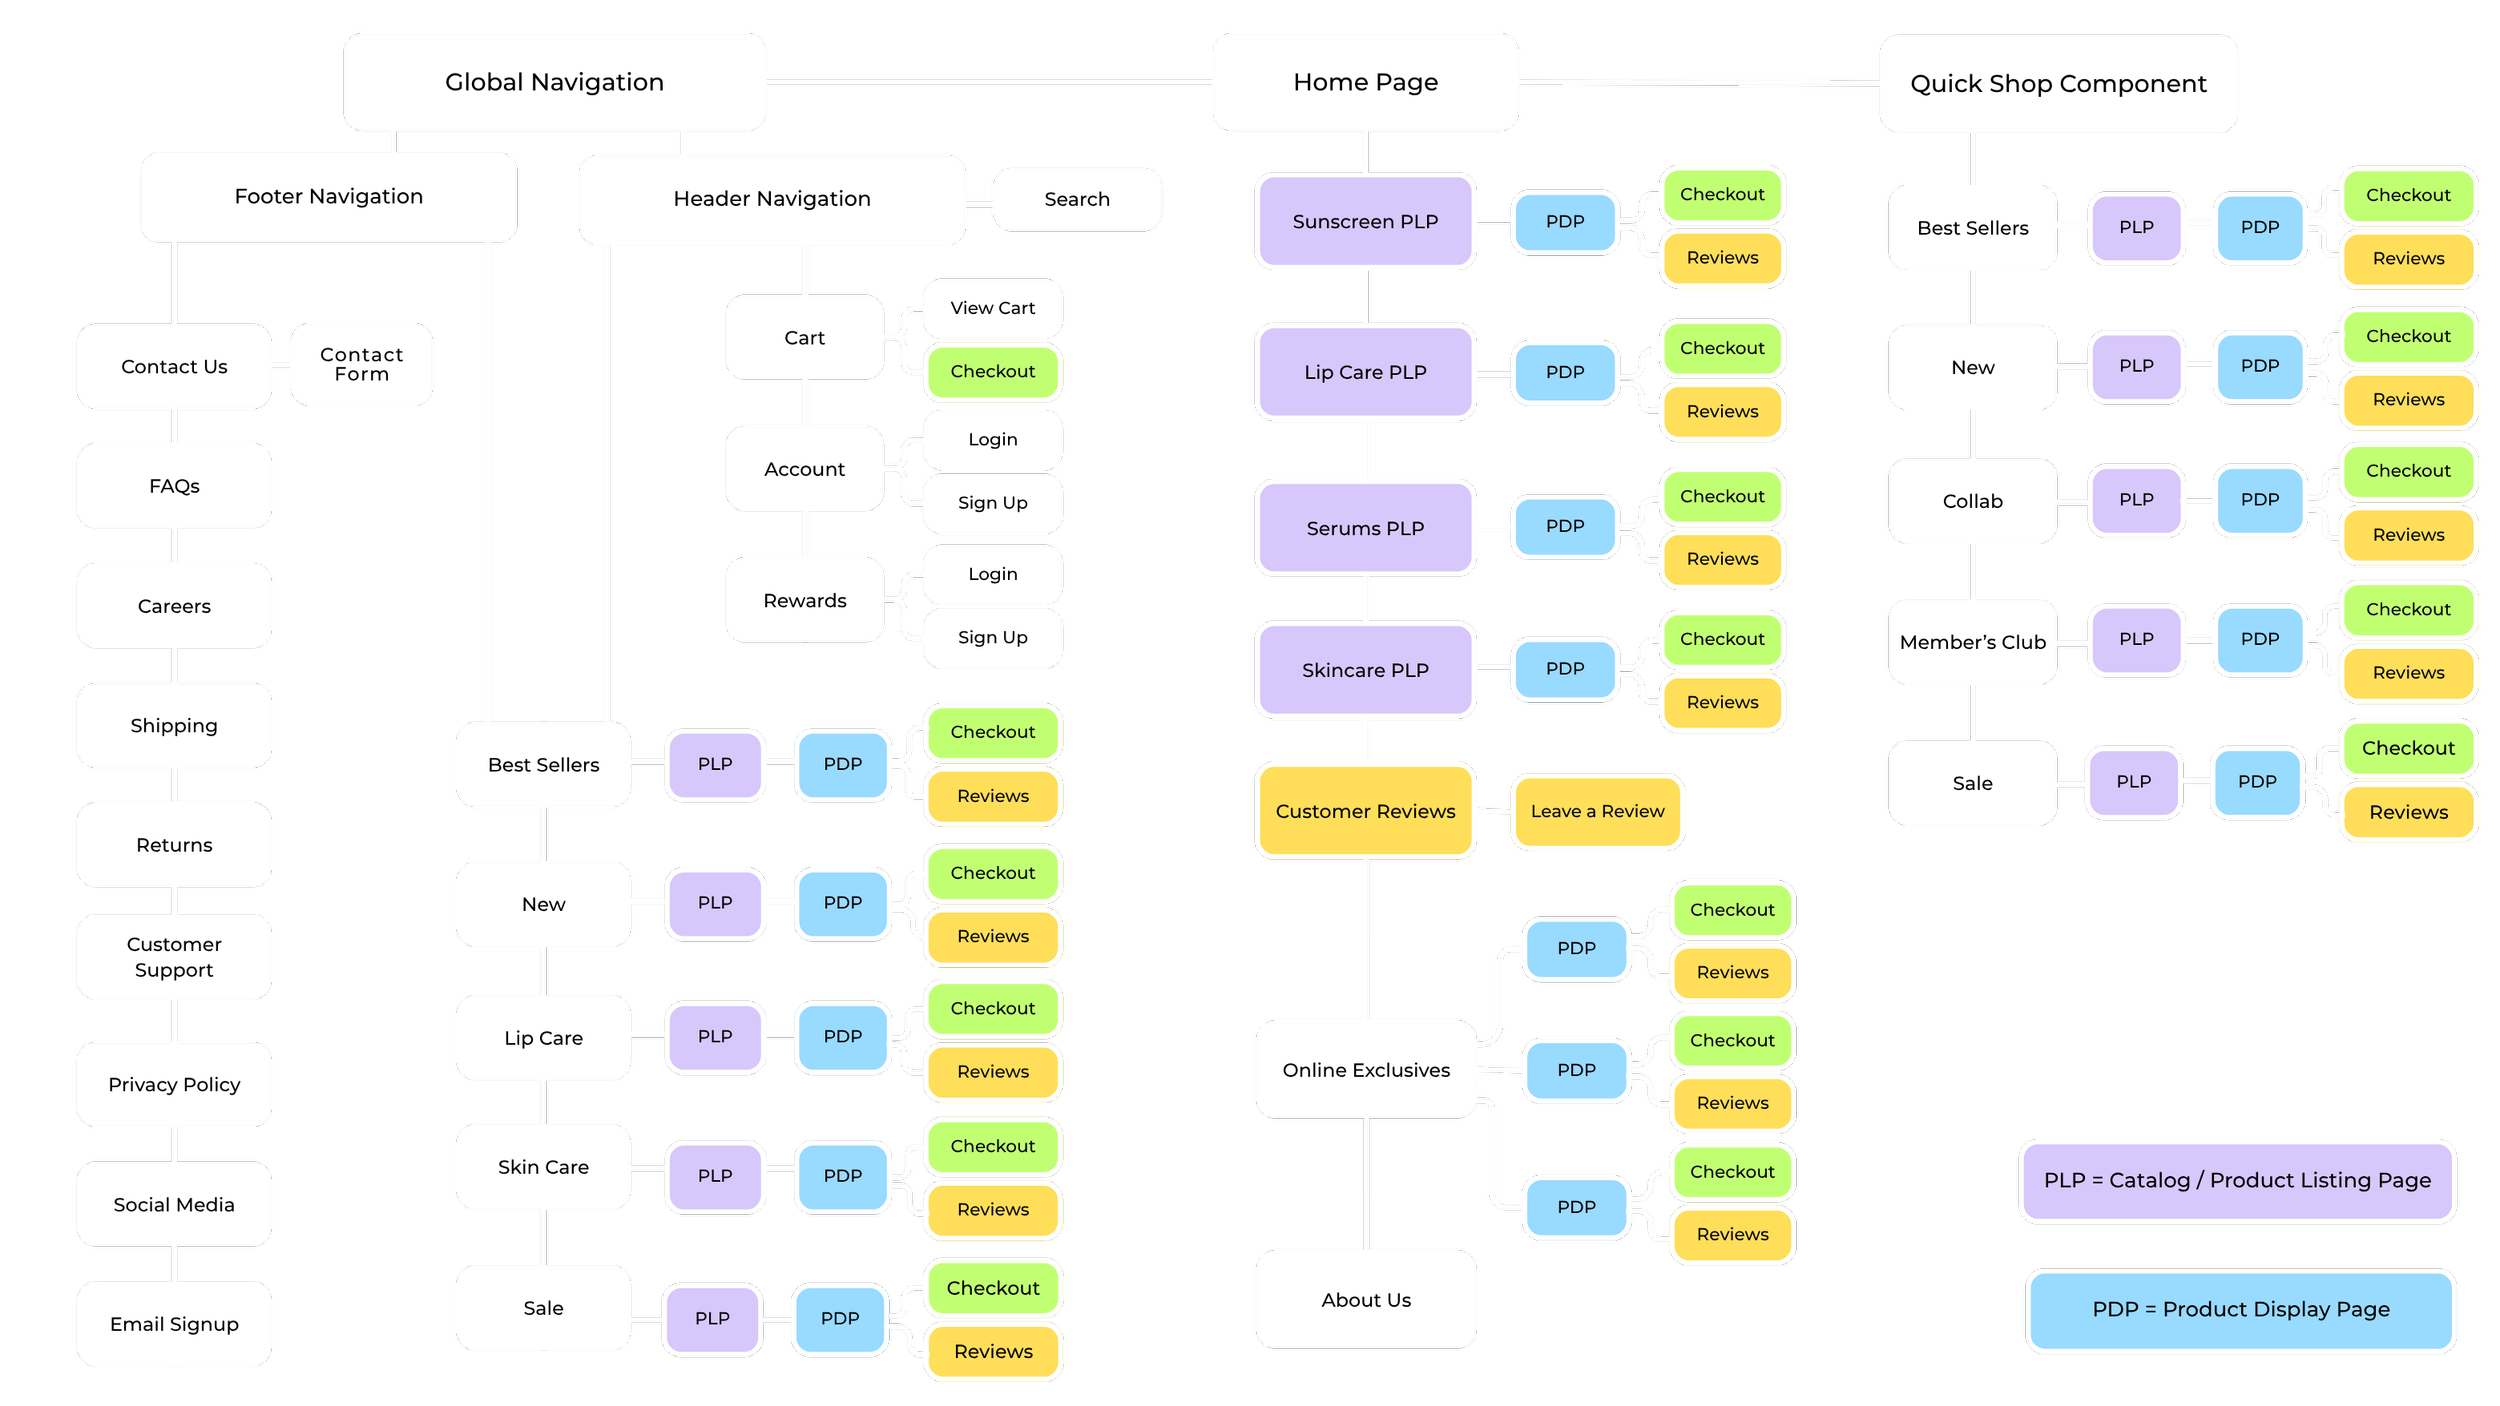
Information Architecture/User Flow
—
Wireframes - Home Page
—
Wireframes - Product Display Page (PDP)
—
Wireframes - Checkout Page
—
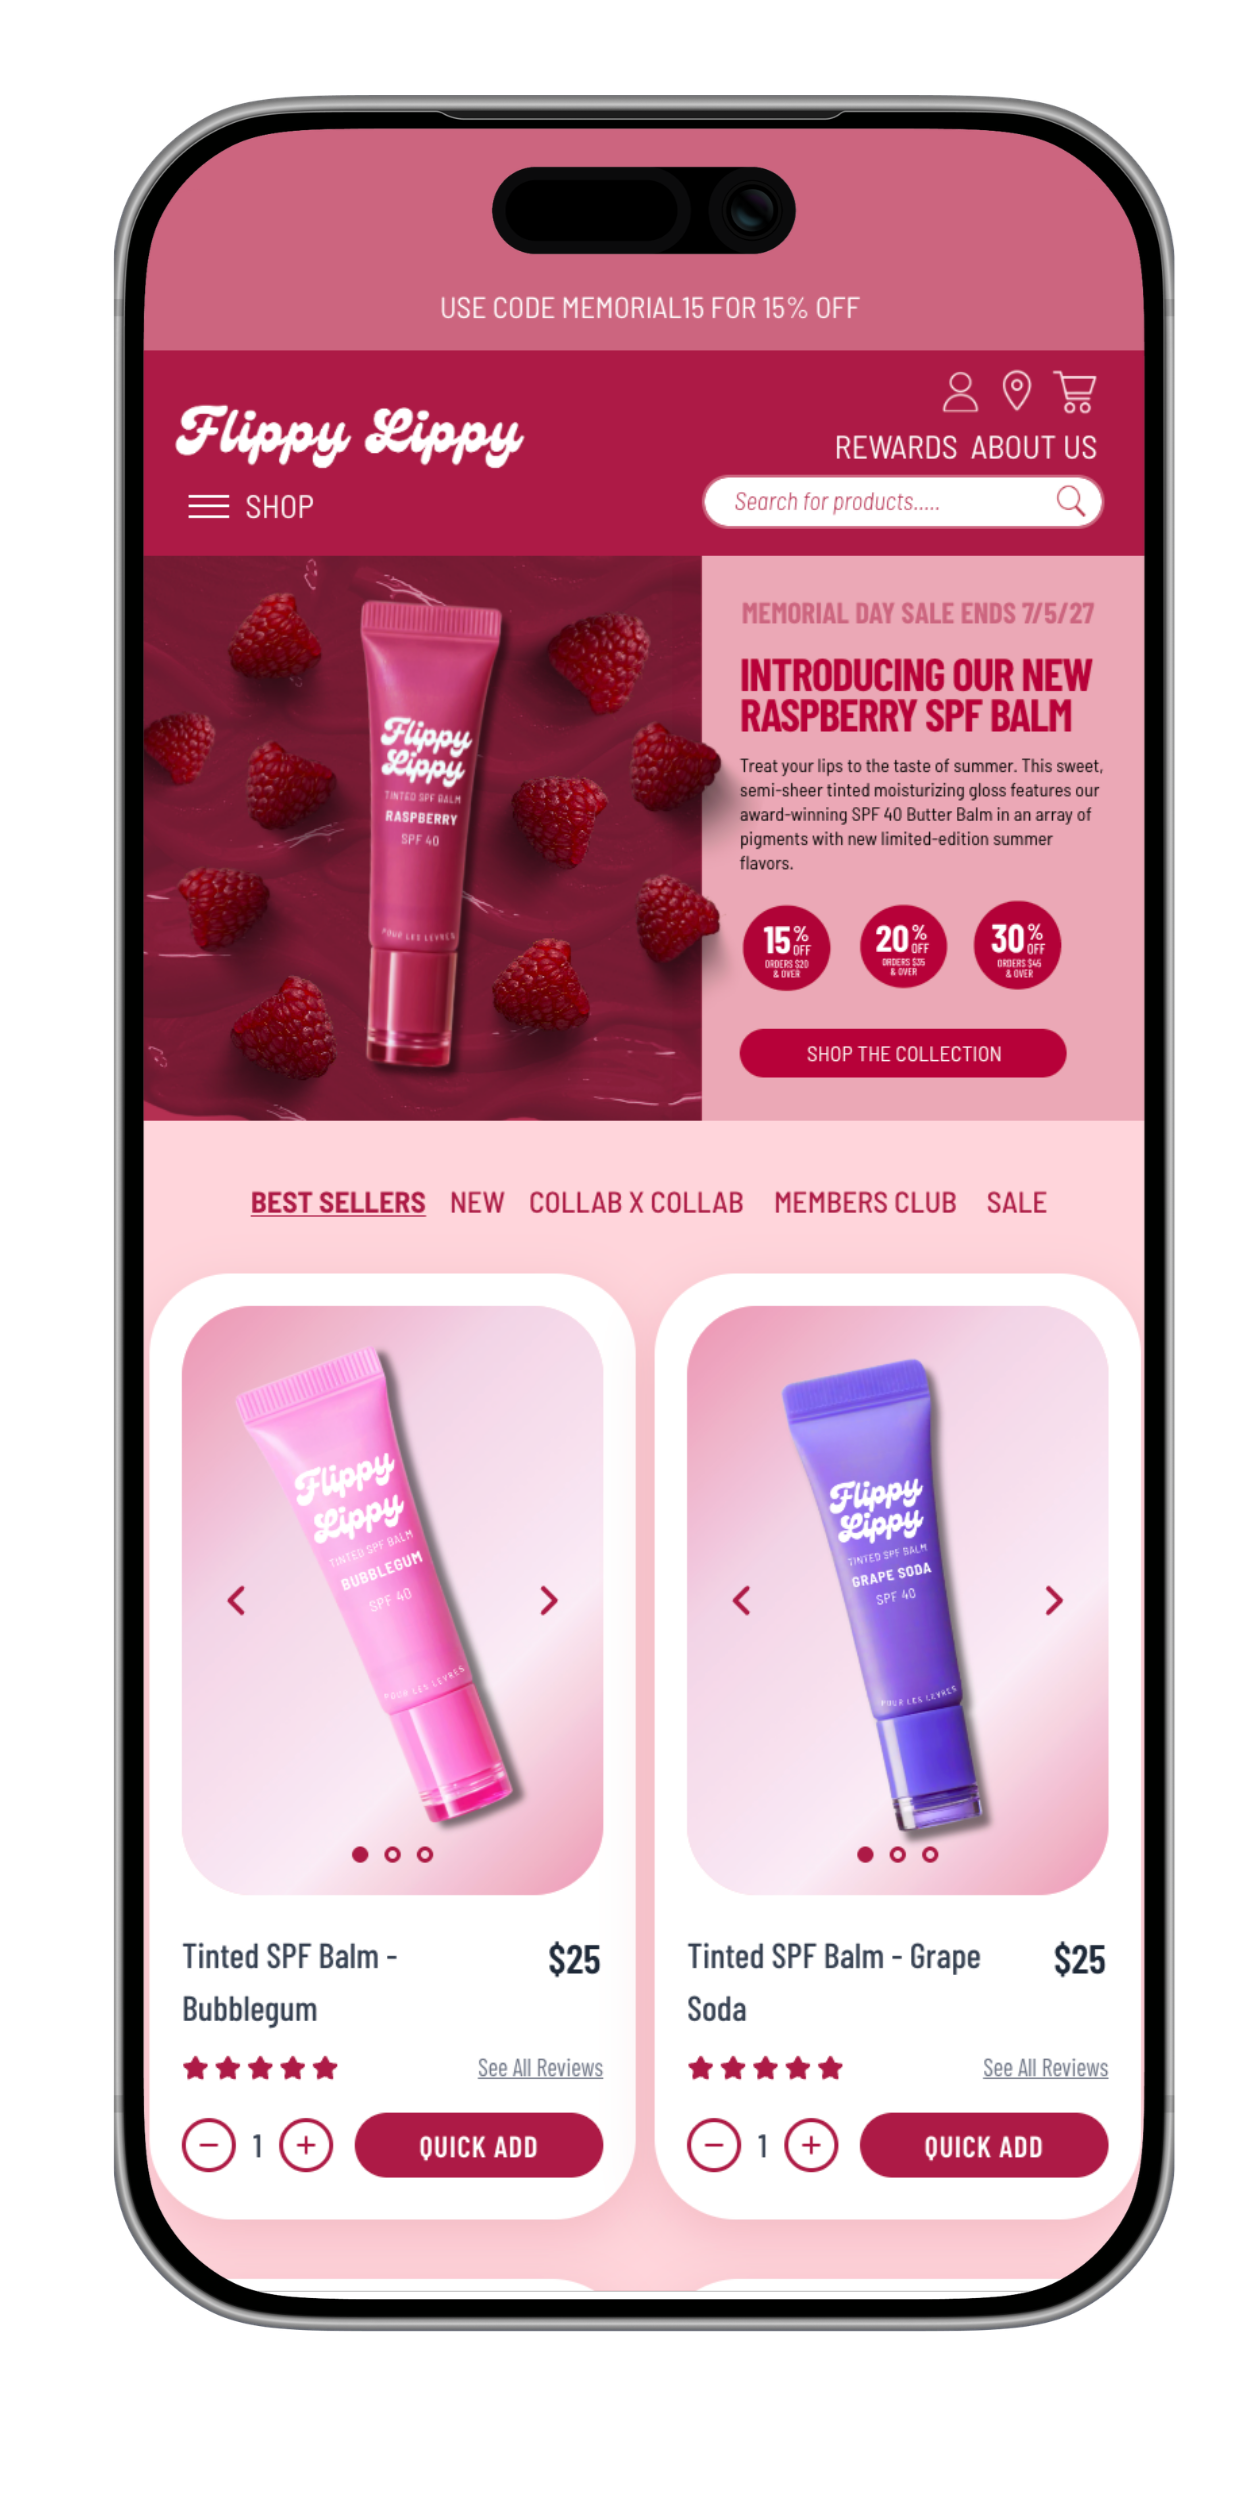
High Fidelity Screens - Home Page
—
———————
In the header design, I decided to make the design interactive by making the lip gloss and the raspberries absolute-positioned individual elements, each with an inverse mouse parallax gently offsetting the elements by 10px. I wanted to engage users and immediately communicate the brand’s fun and fruity vibe, inviting them to explore the page.
I ended up revising my header navigation several times while designing my information architecture, removing redundancies and replacing them with locations users are likely to search for, like sale items. I also made the search bar larger to make searching for specific items more accessible, as it was common feedback I received when conducting hypothetical task completions.
——————————————
———————
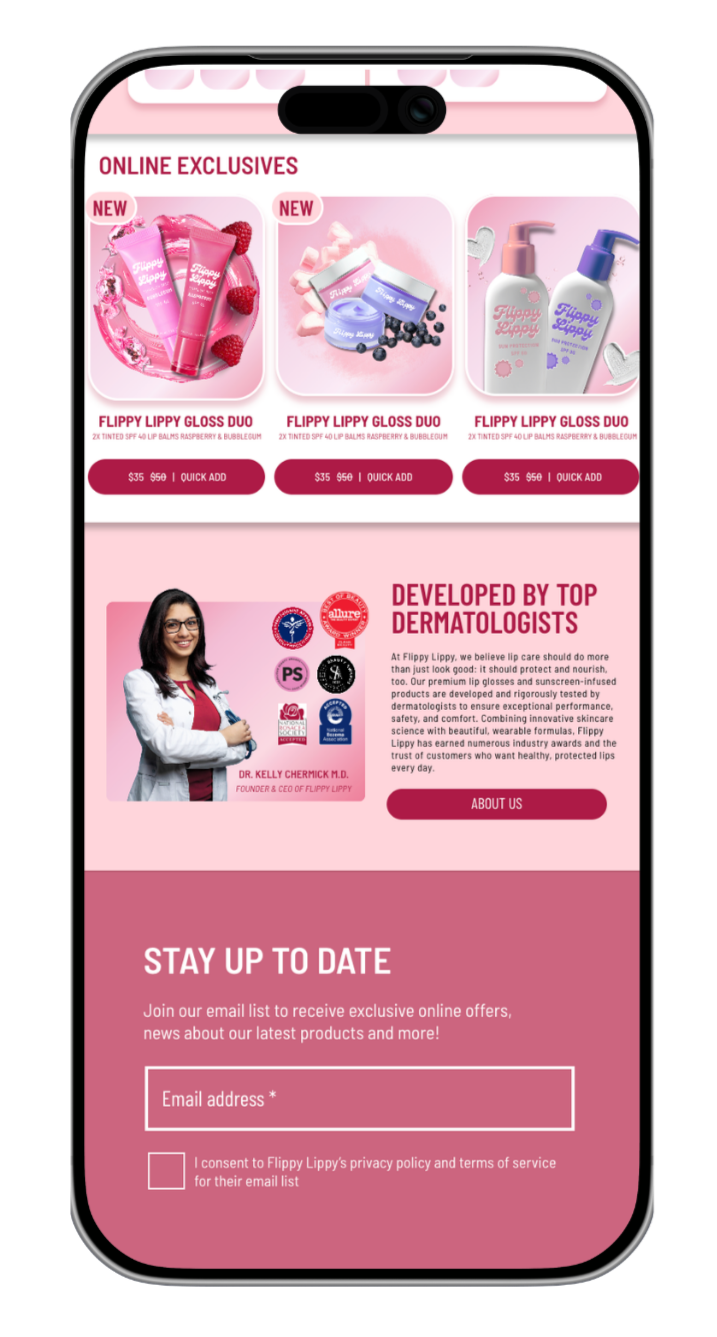
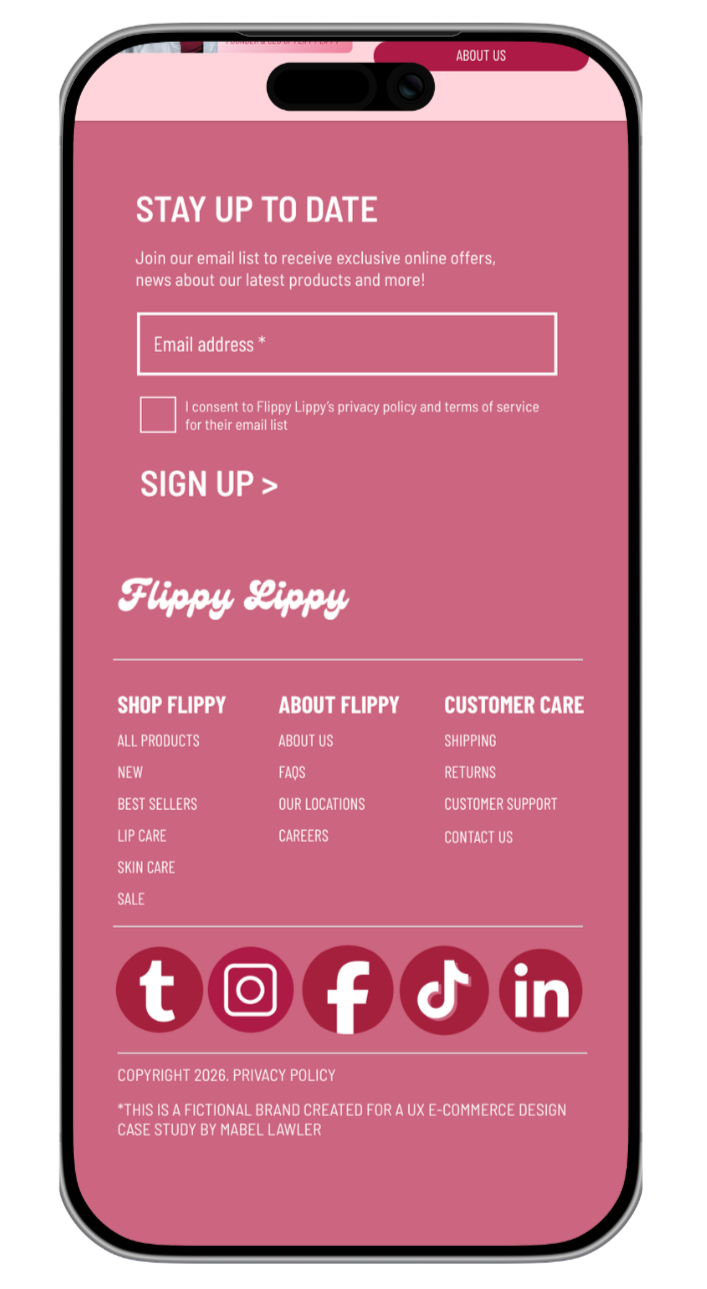
To optimize my page for mobile, I took inspiration from mobile e-commerce platforms I frequent as well as the mobile versions of Laneige and Summer Fridays from my competitive analysis. I did my best to optimize the page without making it feel too long or clunky. I personally really enjoy the layout of my mobile footer.
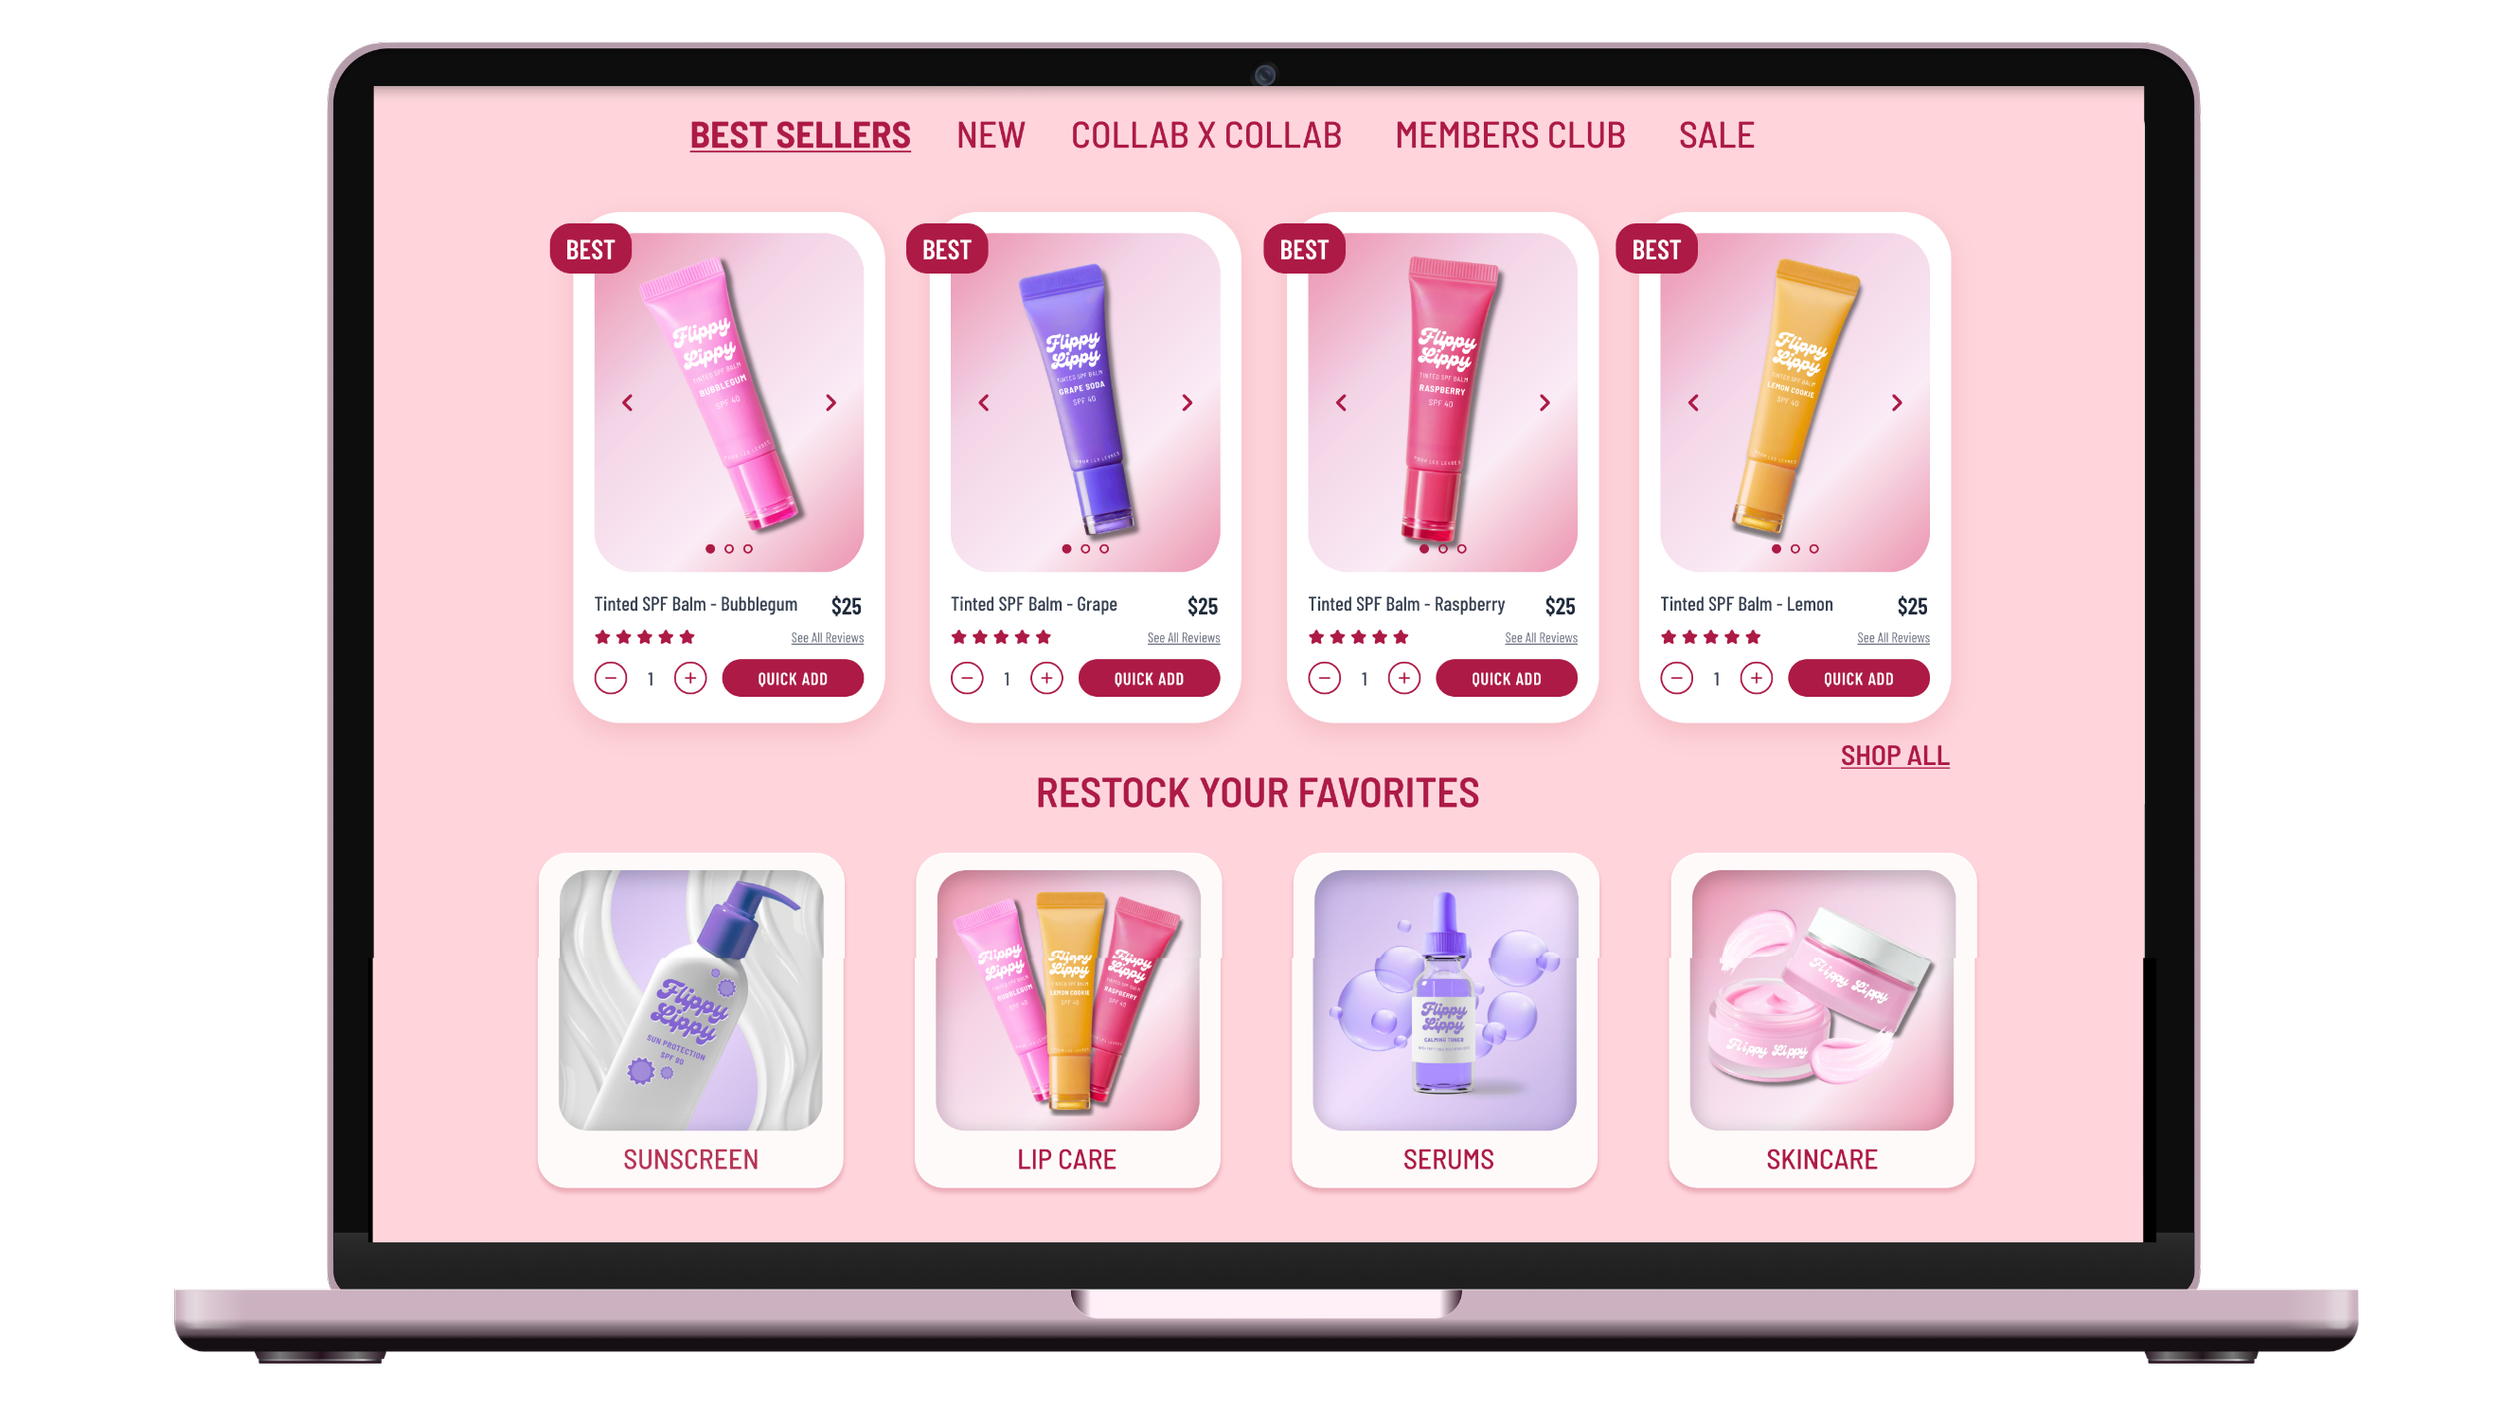
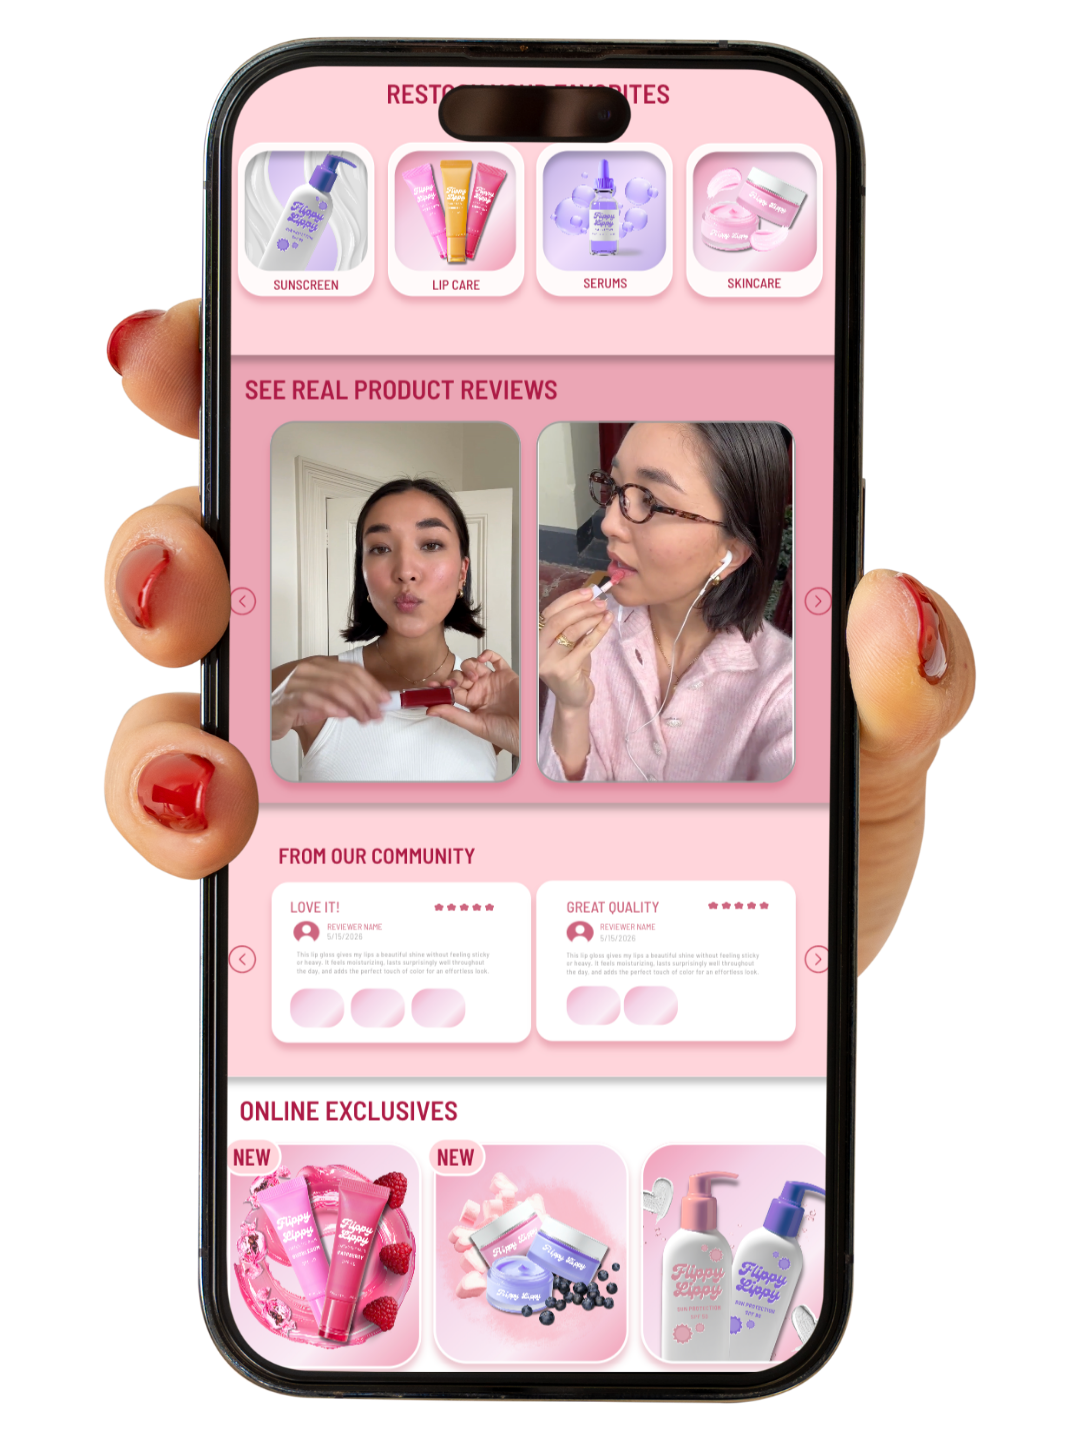
This section positioned directly below the header is the aforementioned quick shop component in my information architecture. This was implemented to achieve the objective of creating a frictionless path to the ‘star’ product. These quick shop components are made with React and functional on the live prototype pages.
——————————————
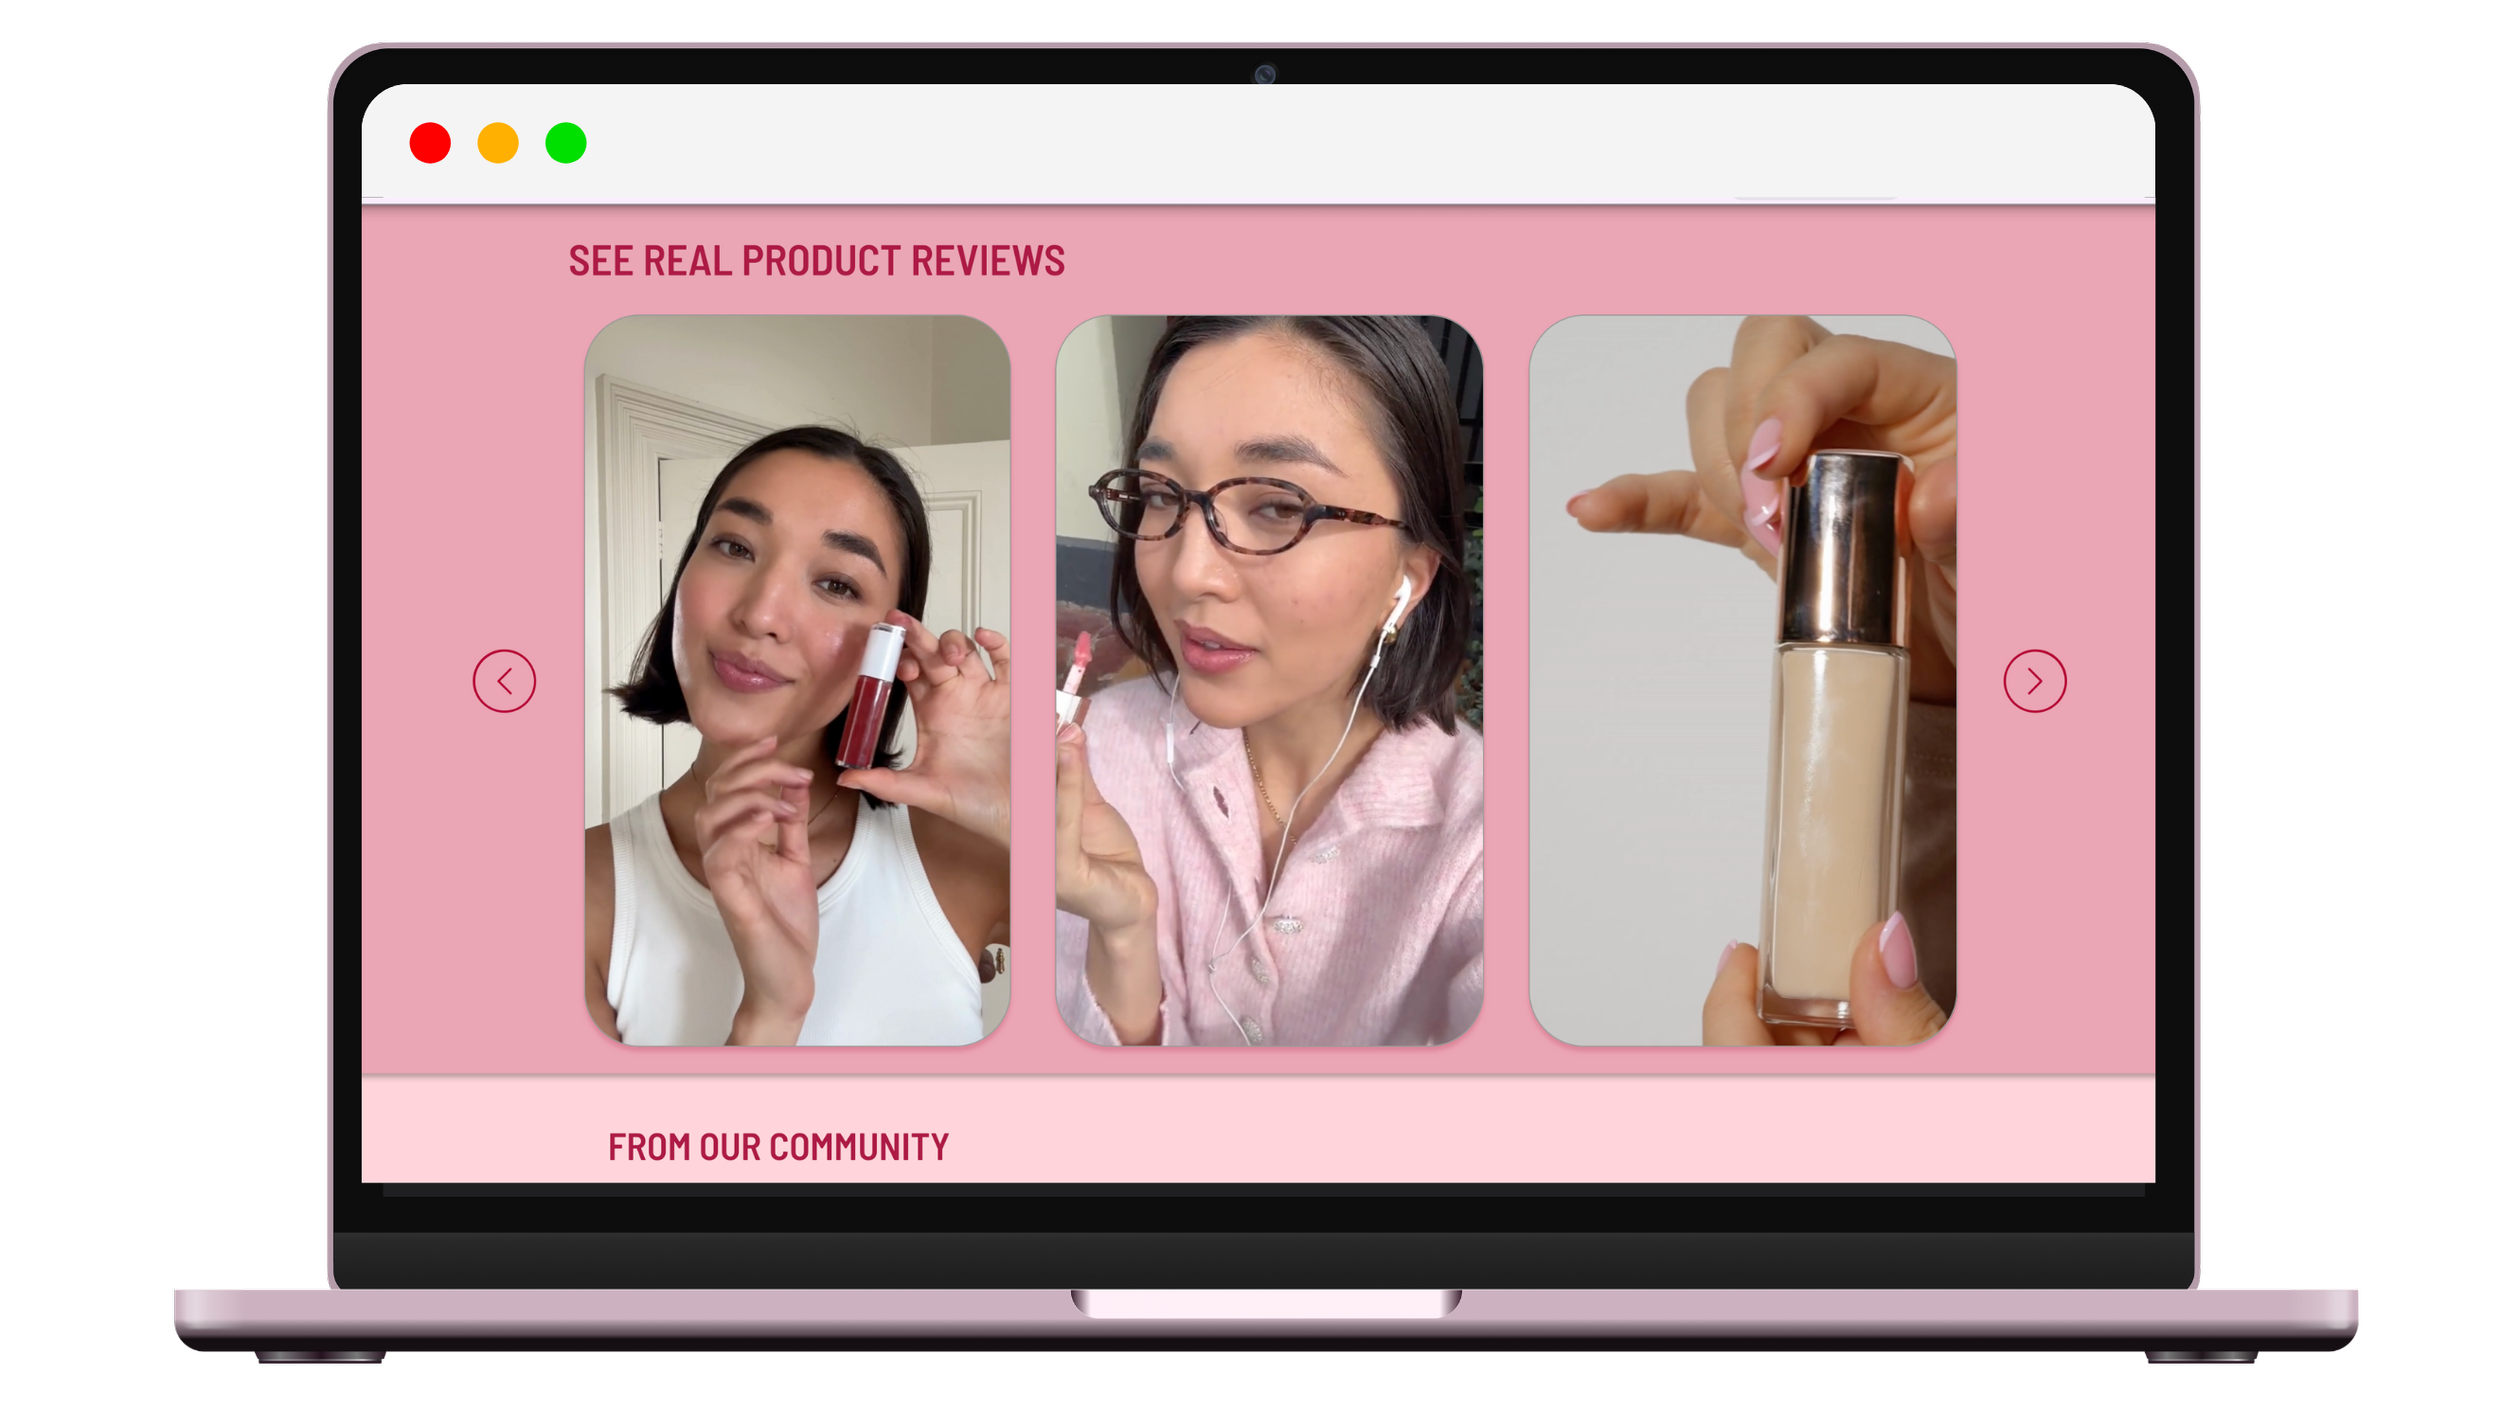
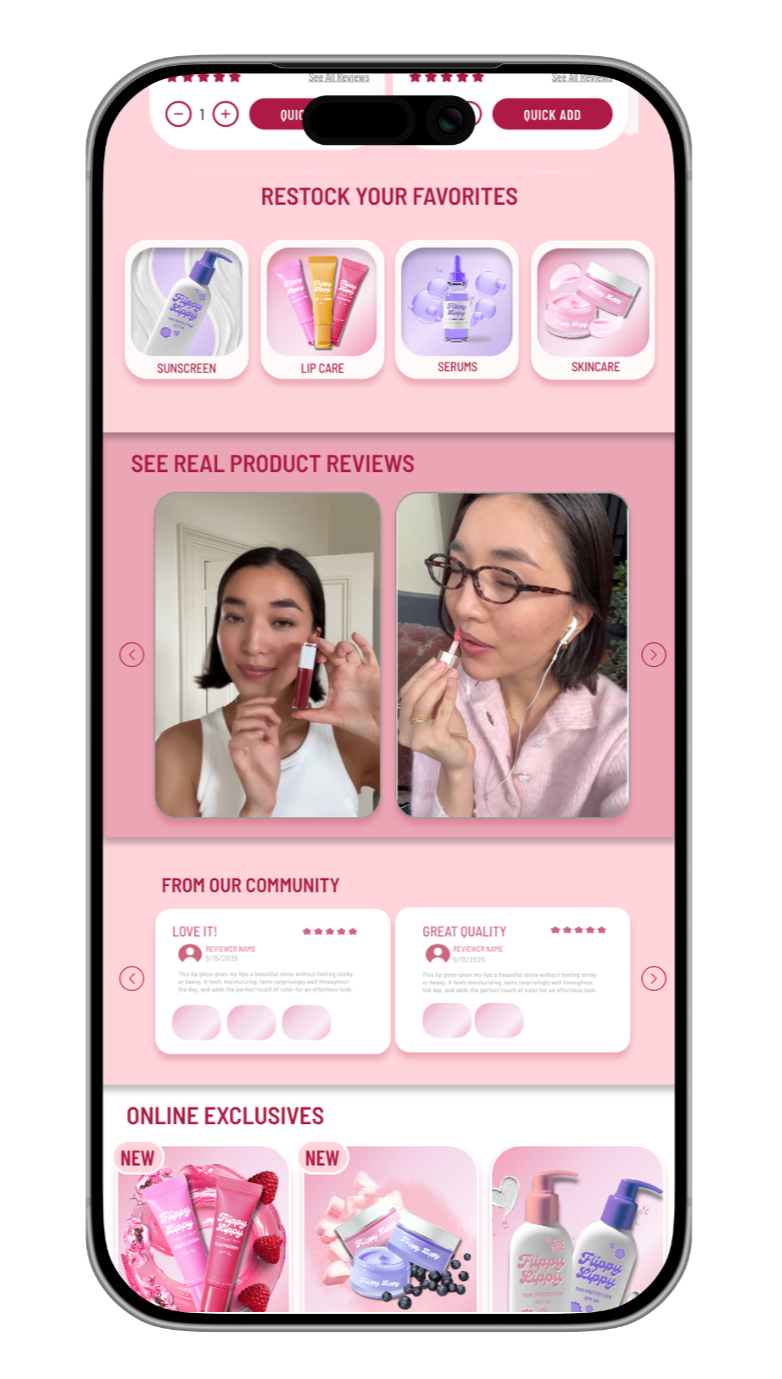
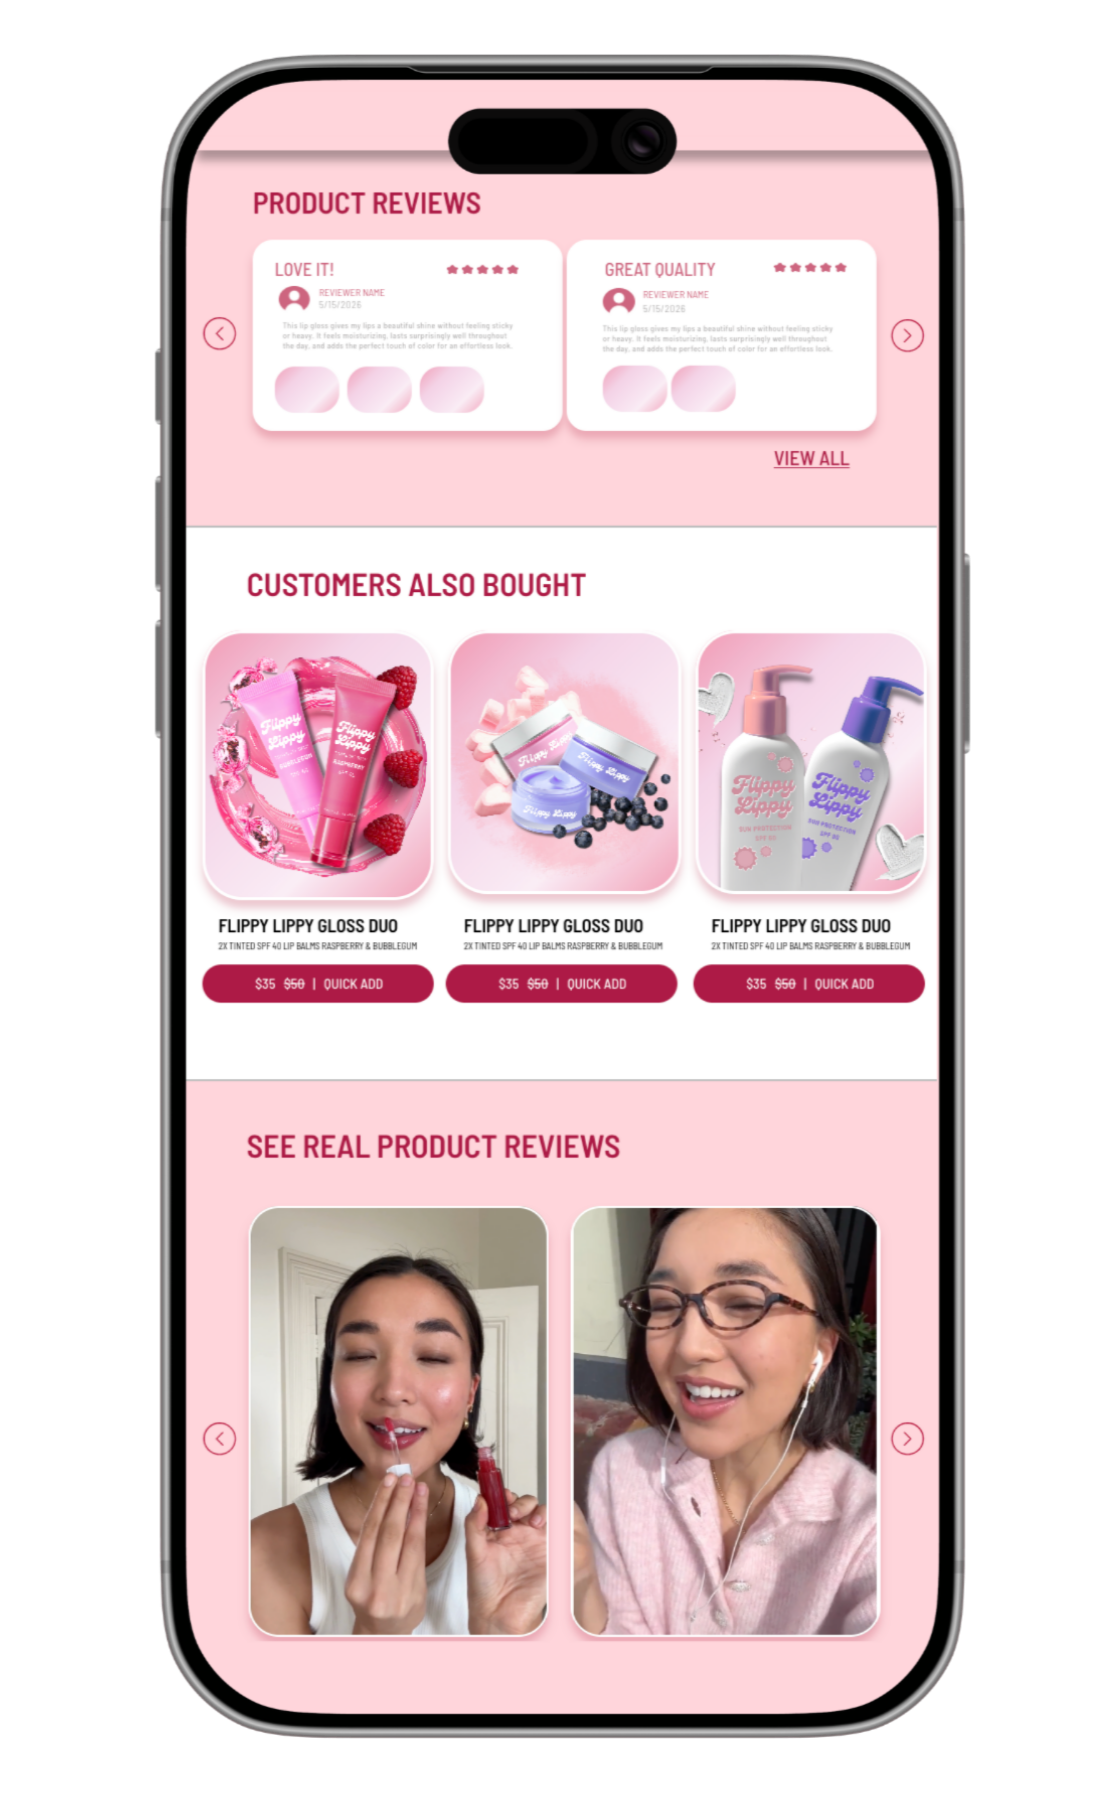
I featured prominent video reviews / social media content on the home page to further my objective of building trust and credibility through social proof and product demonstration.
—————————————

This brand trust and credibility through social proof strategy was furthered by providing the written reviews section right below the video reviews. Below the reviews, I included another products section, using verbiage like ‘EXCLUSIVES’ and ‘NEW’ to entice the user. The architecture design would be for the product images to take the user to that specific PDP, but there is also a quick shop ‘add to cart’ element below.
——————————————
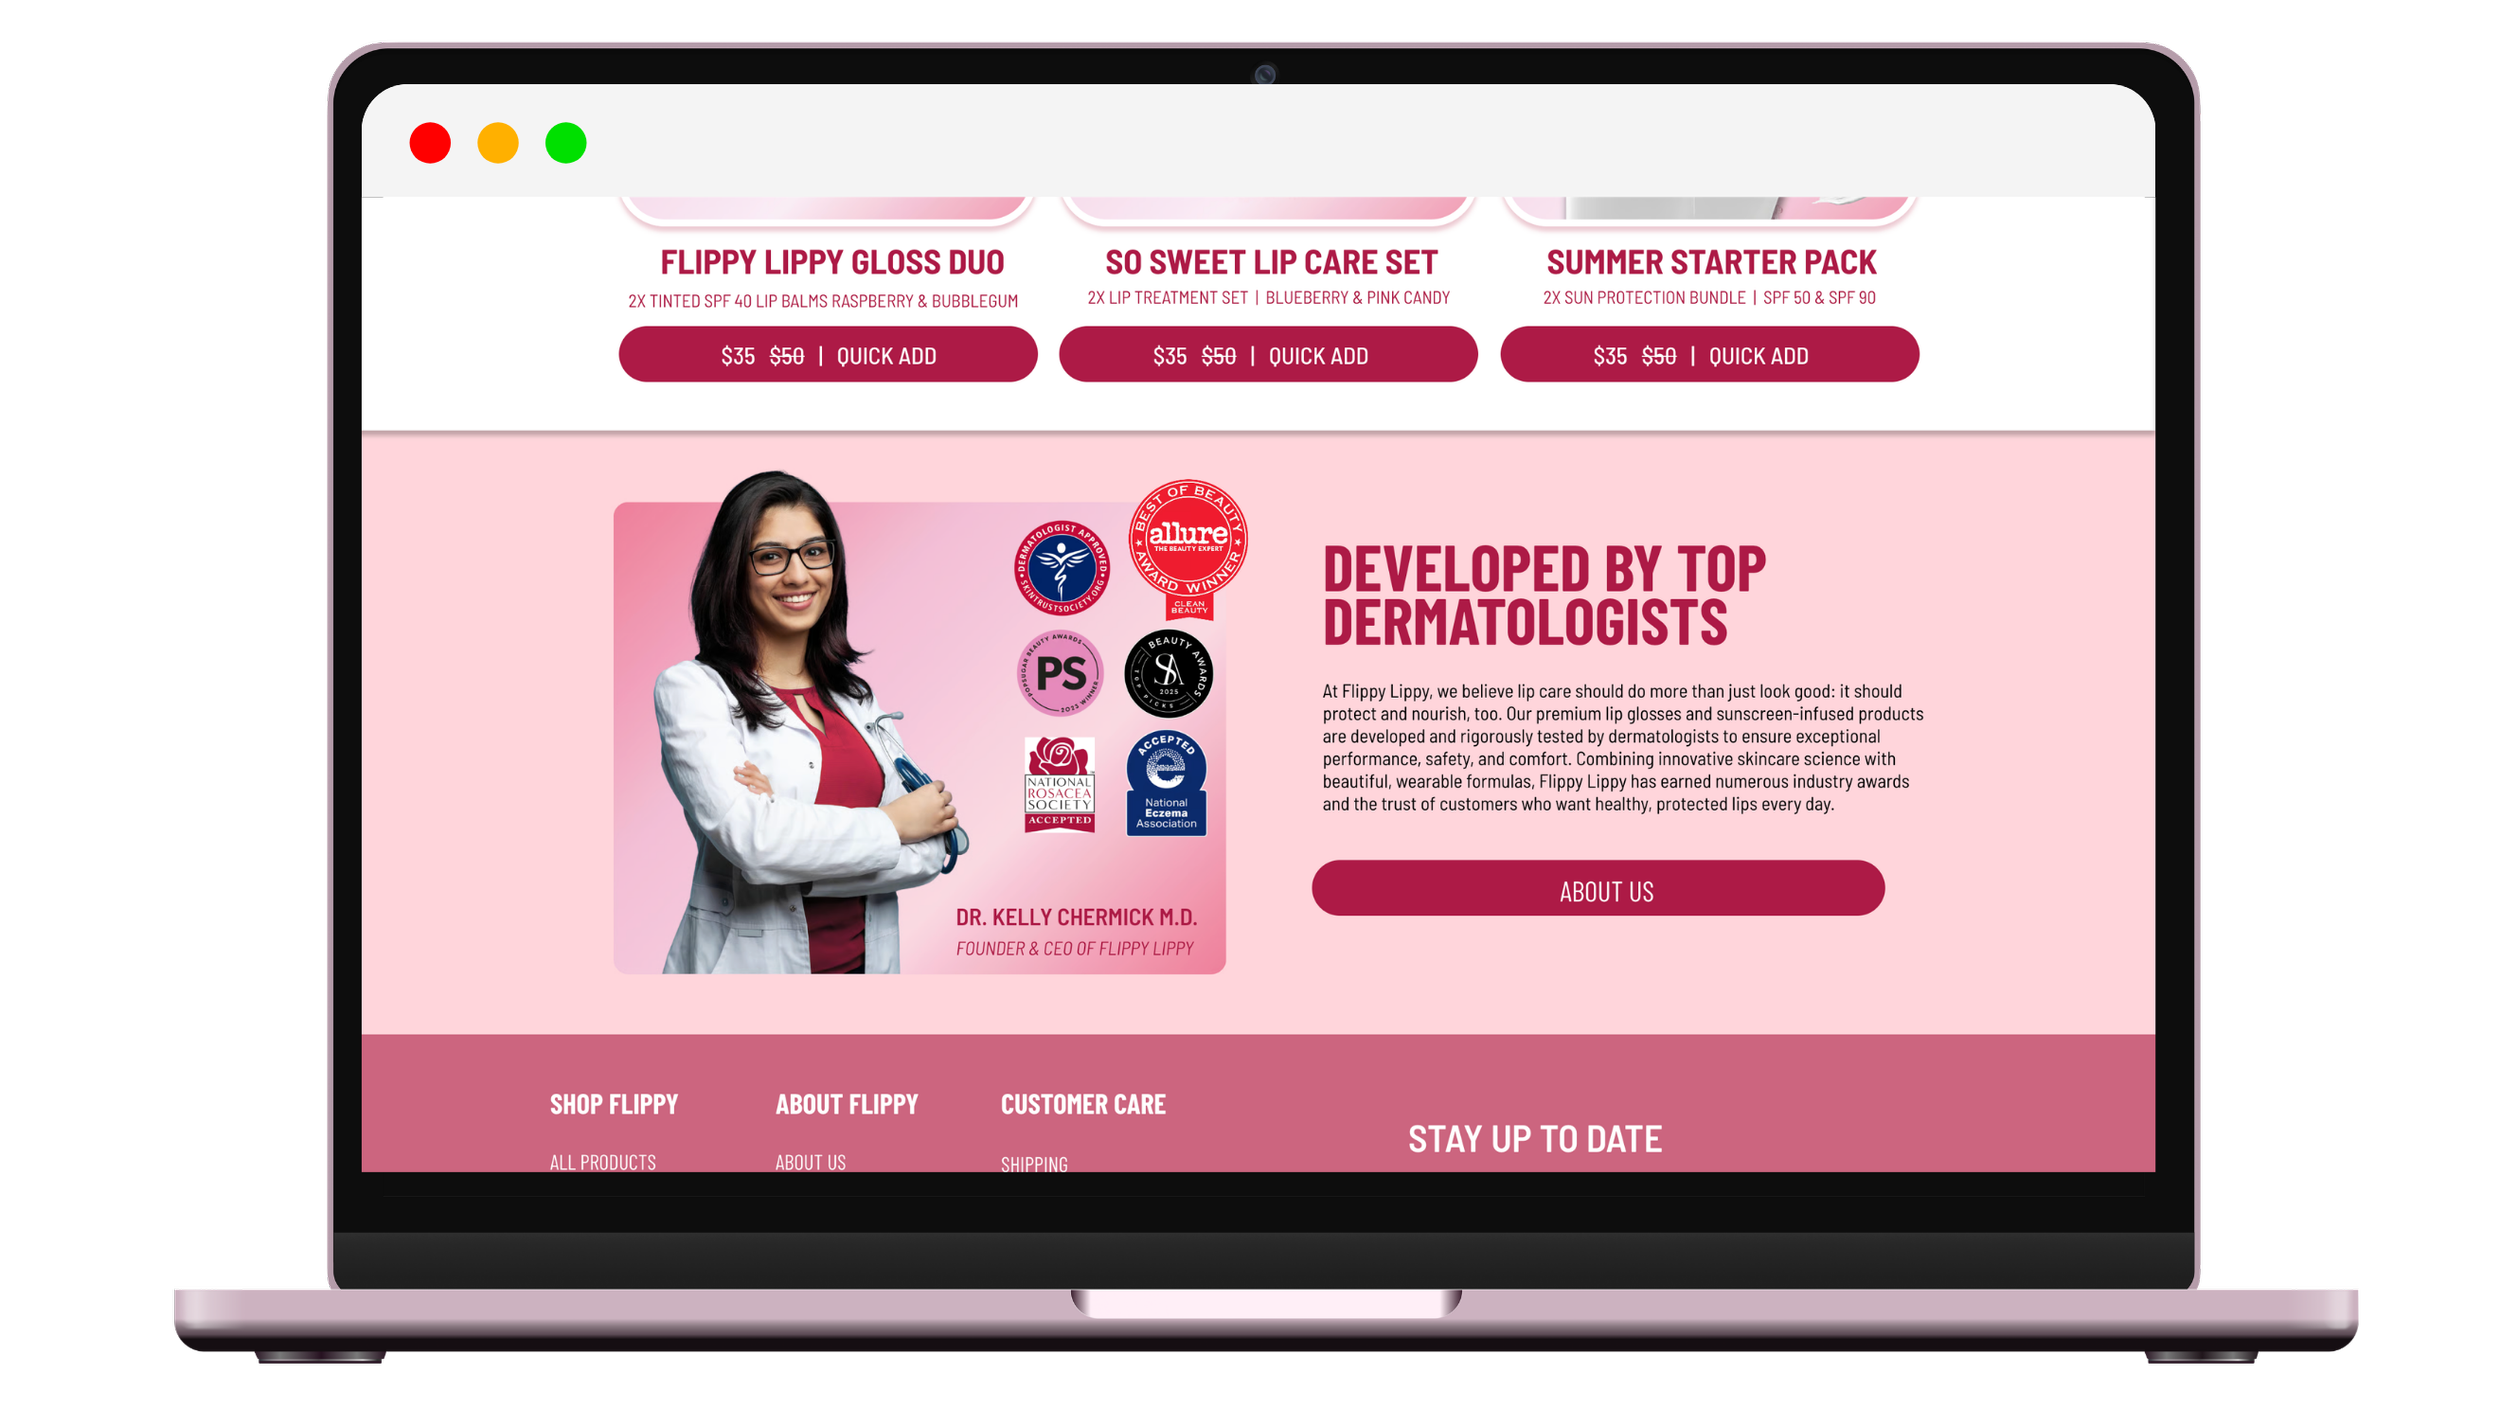
I styled this home page ‘about us’ section with the intention of combining Flippy’s fun, fruity aesthetic with clinical credibility by utilizing a photo of the founder & CEO dressed in her professional medical attire, and by utilizing industry and organization awards as trust badges to further build credibility.
——————————————

High Fidelity Screens - Product Display
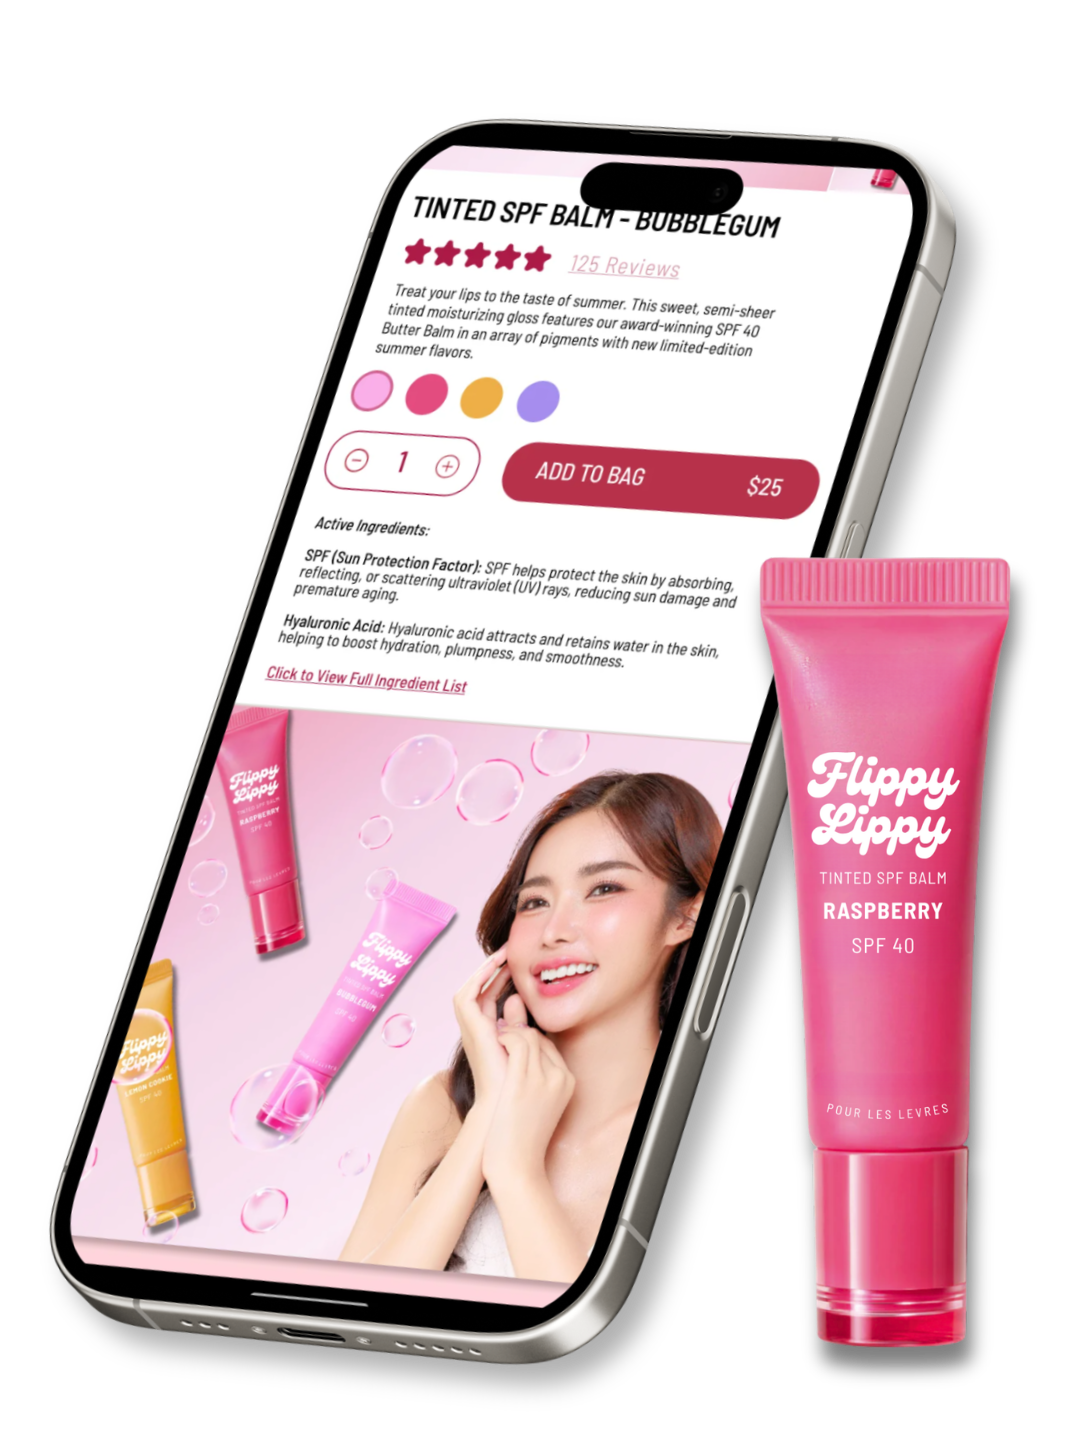
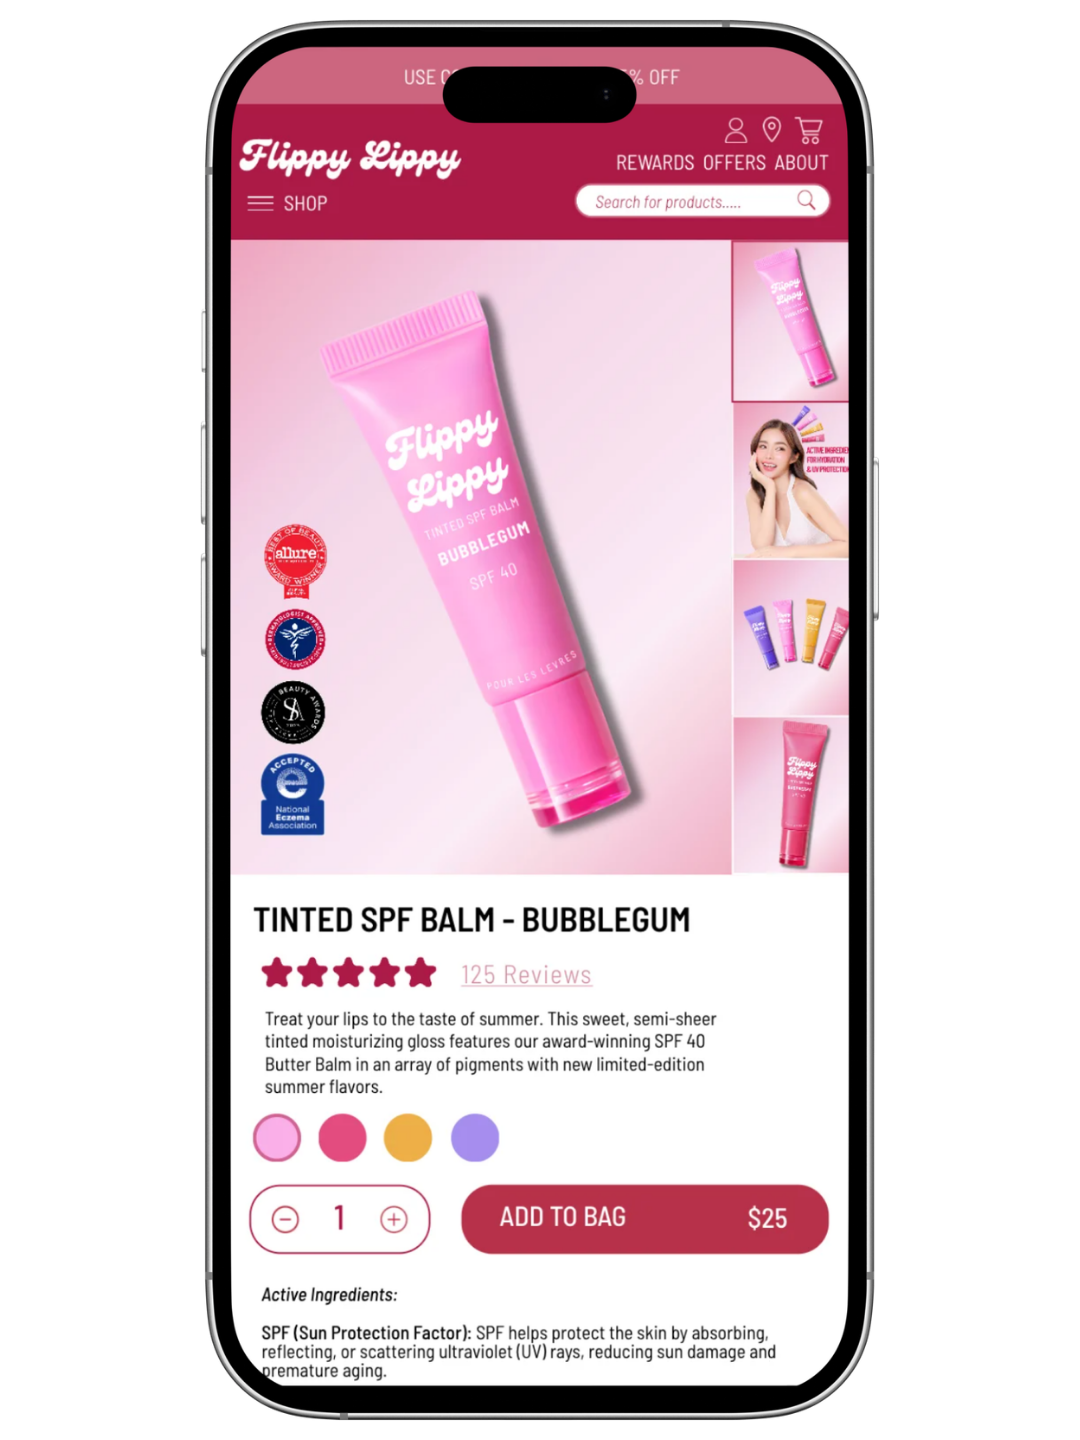
This section initially had a different design in my wireframe, but after testing usability and comparing with other PDP layouts, I decided to alter it to this design, which feels like a more efficient use of the space. This dynamic carousel paired with my product display images feels more attractive from a user standpoint as well. As you can see, the main product image in the display carousel contains several industry awards which act as trust badges and further establish product trust and credibility.
——————————————
—
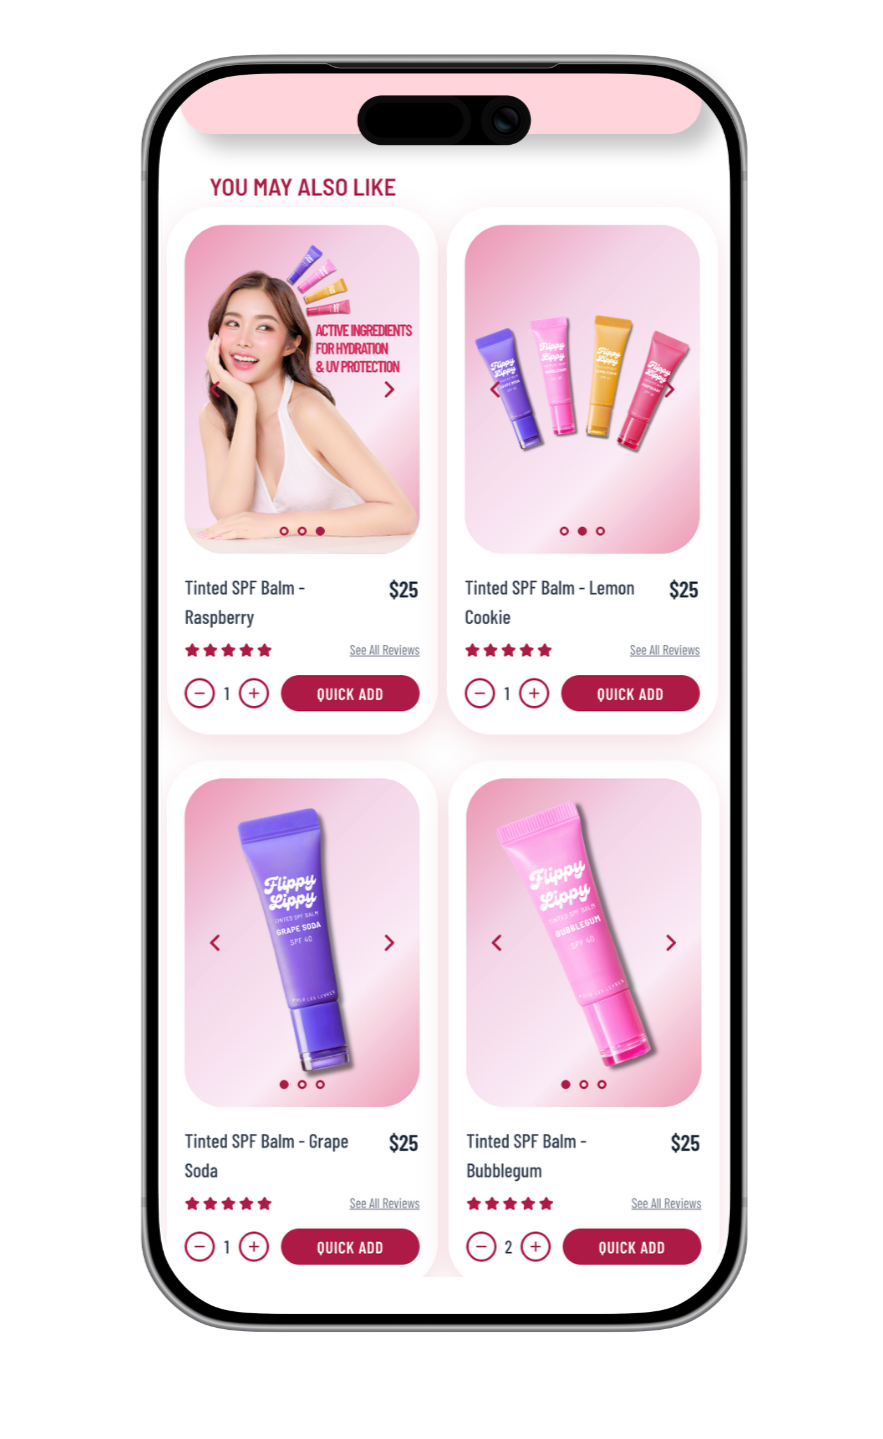
At the bottom of the PDP page, I implemented another section of quickshop elements which would be utilized as the ‘recommended products’ part of the page.
——————————————

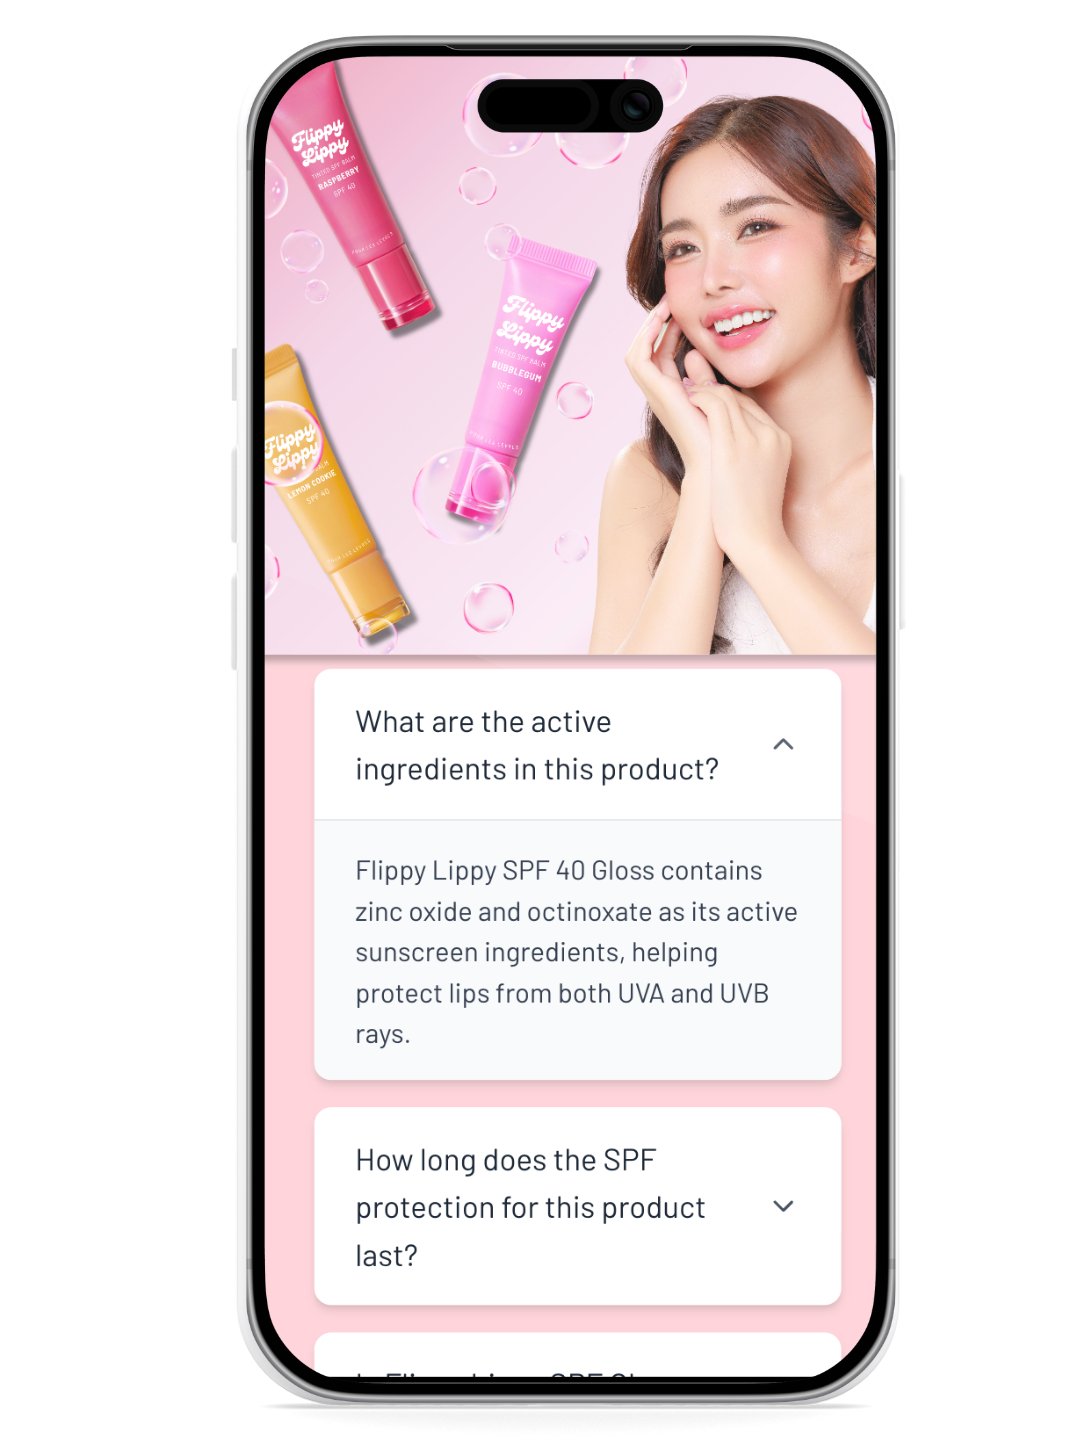
Below the product display I included a short product description, an up-front active ingredient explanation, and a link / potential accordion to the full ingredient list. Below this, I included another React component which functions as an accordion to answer frequently asked questions about the product, to further build trust with more product explanations asked by users.
——————————————
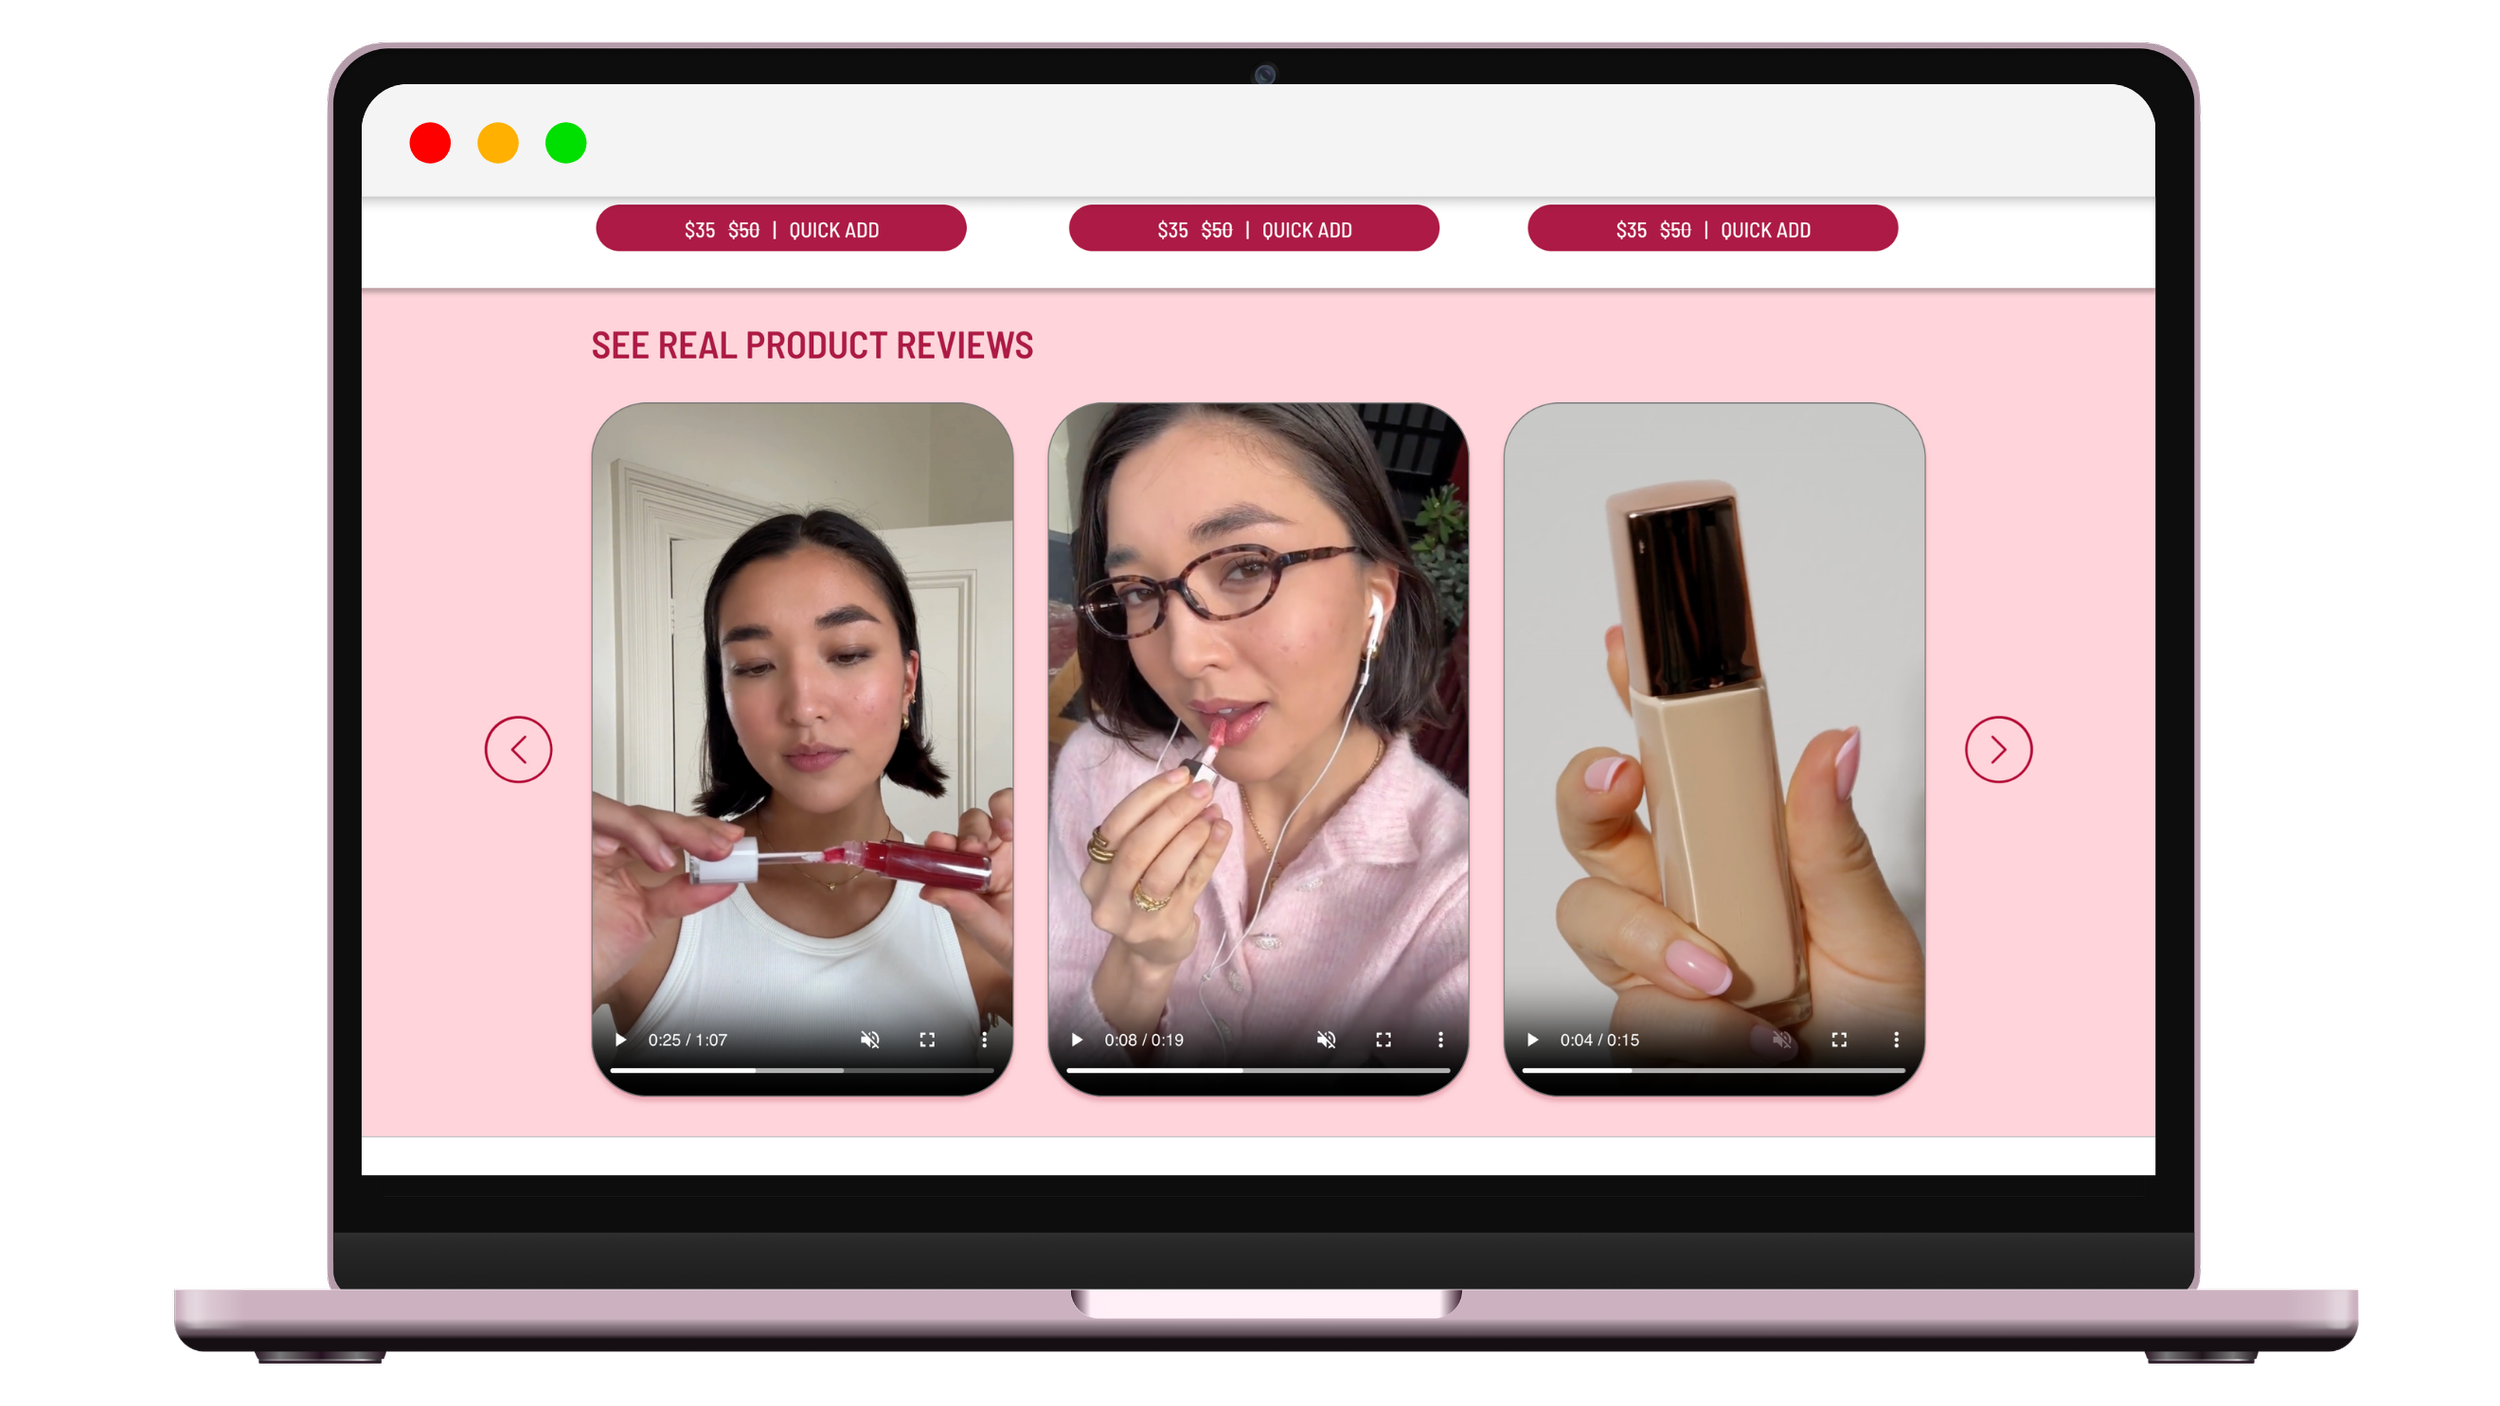
Below the product FAQs section, I included another written and video reviews section, the written reviews section on this page is of course for the specific product, and ideally the video reviews would just be that product as well. This implementation works to further the strategy of converting users to buyers through accessible reviews.
——————————————
High Fidelity Screens - Checkout Page

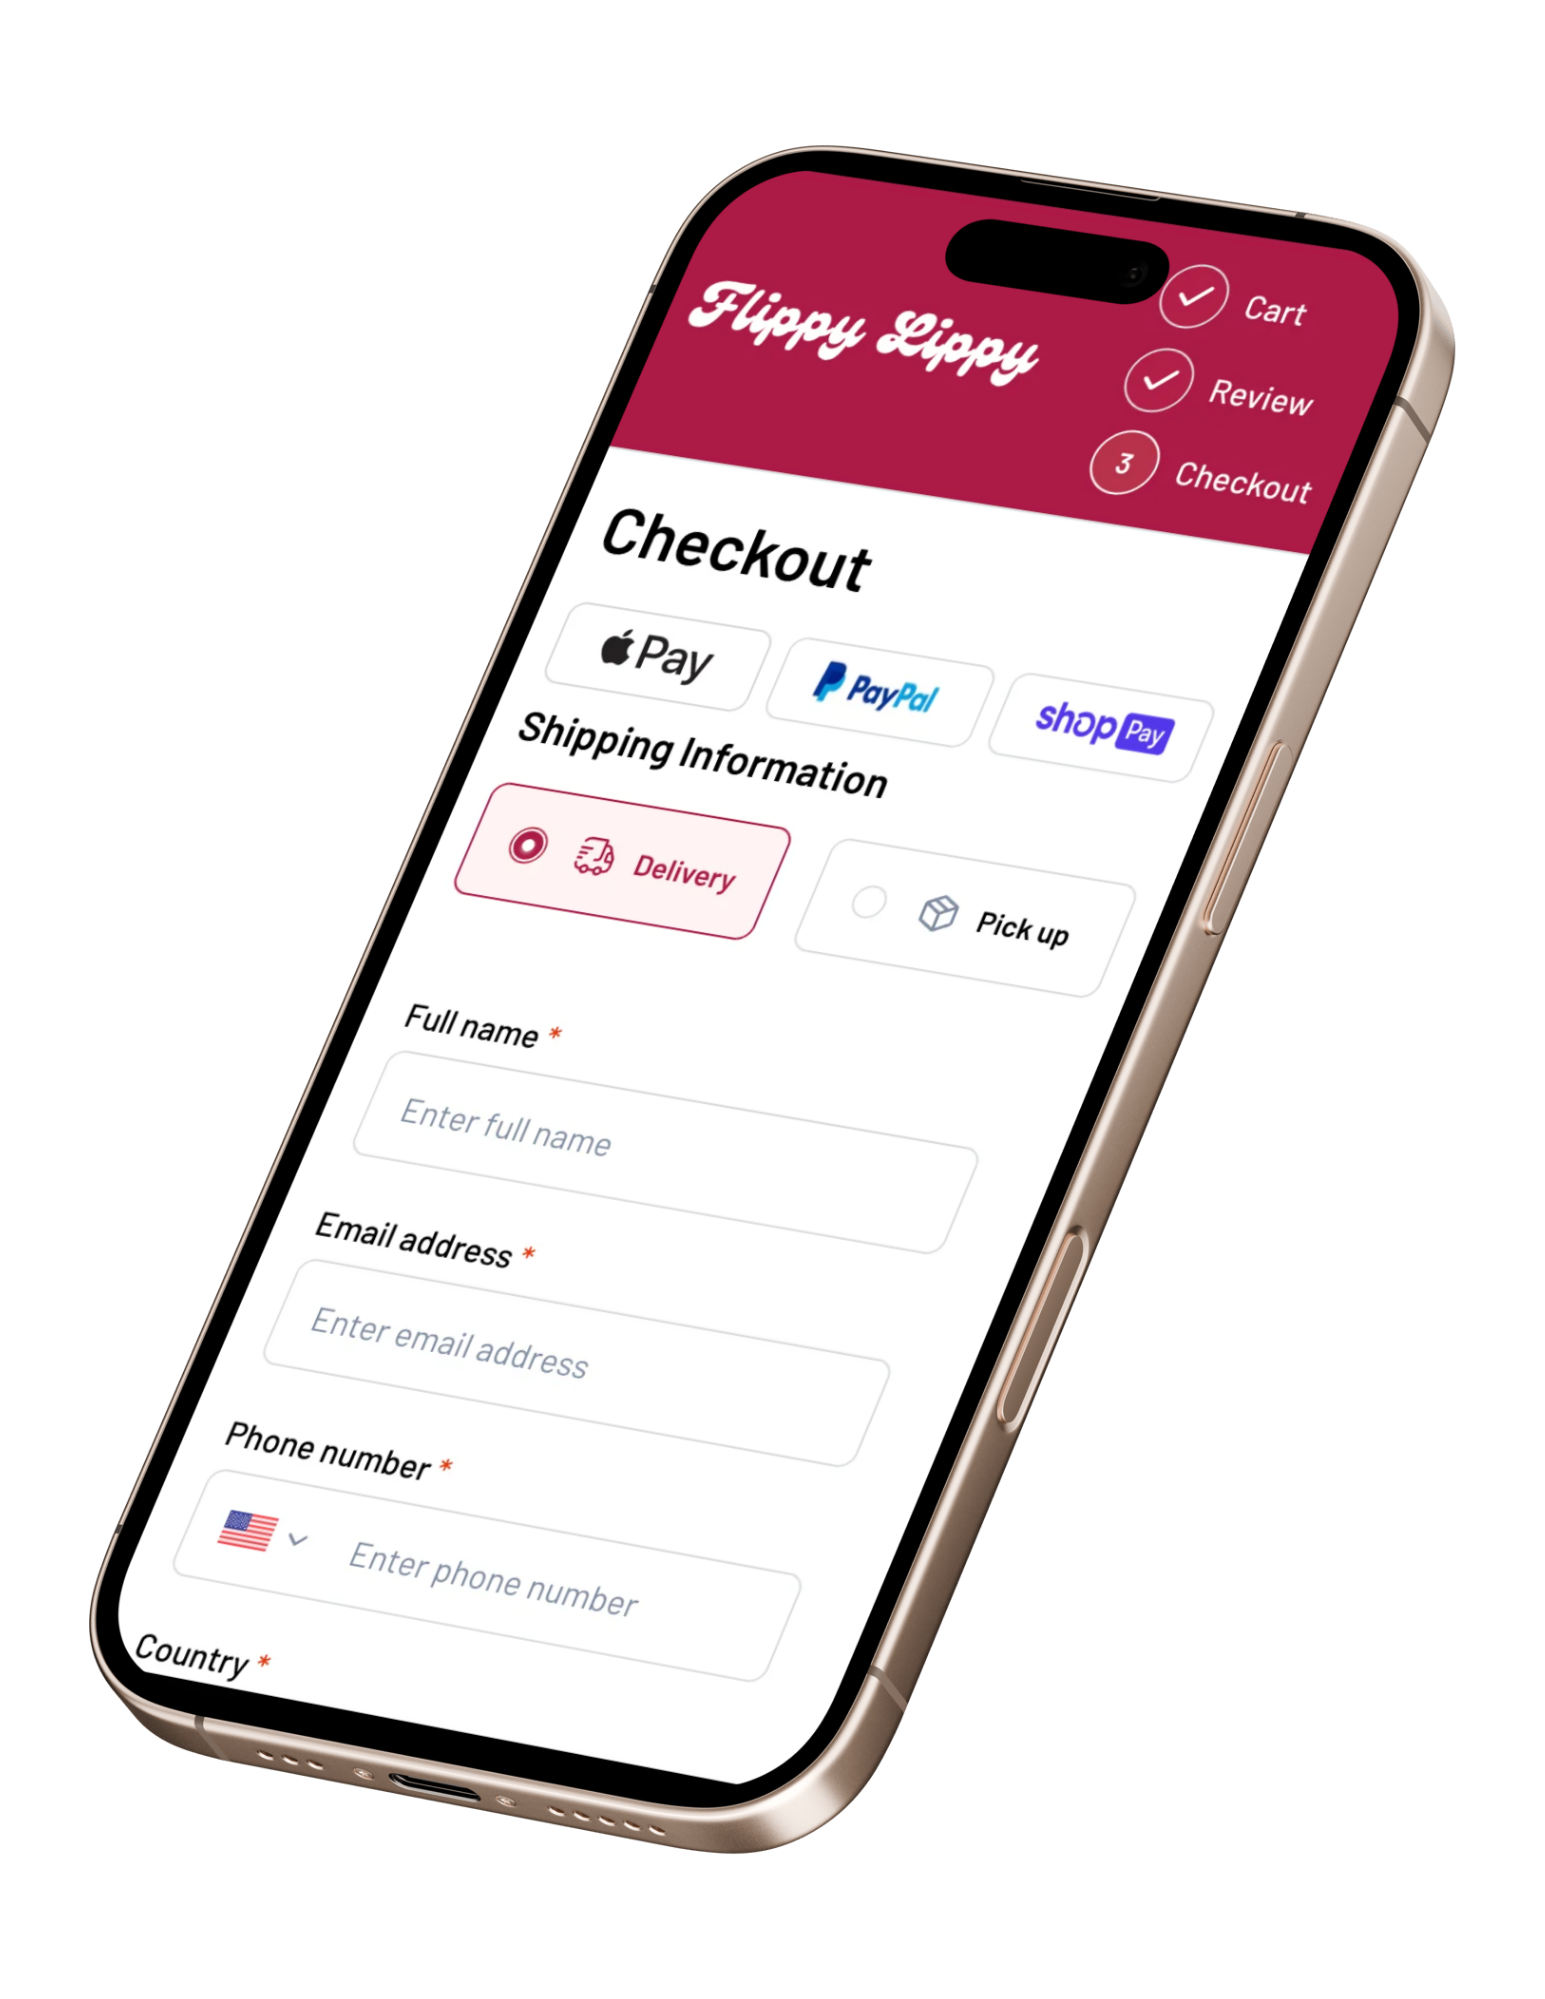
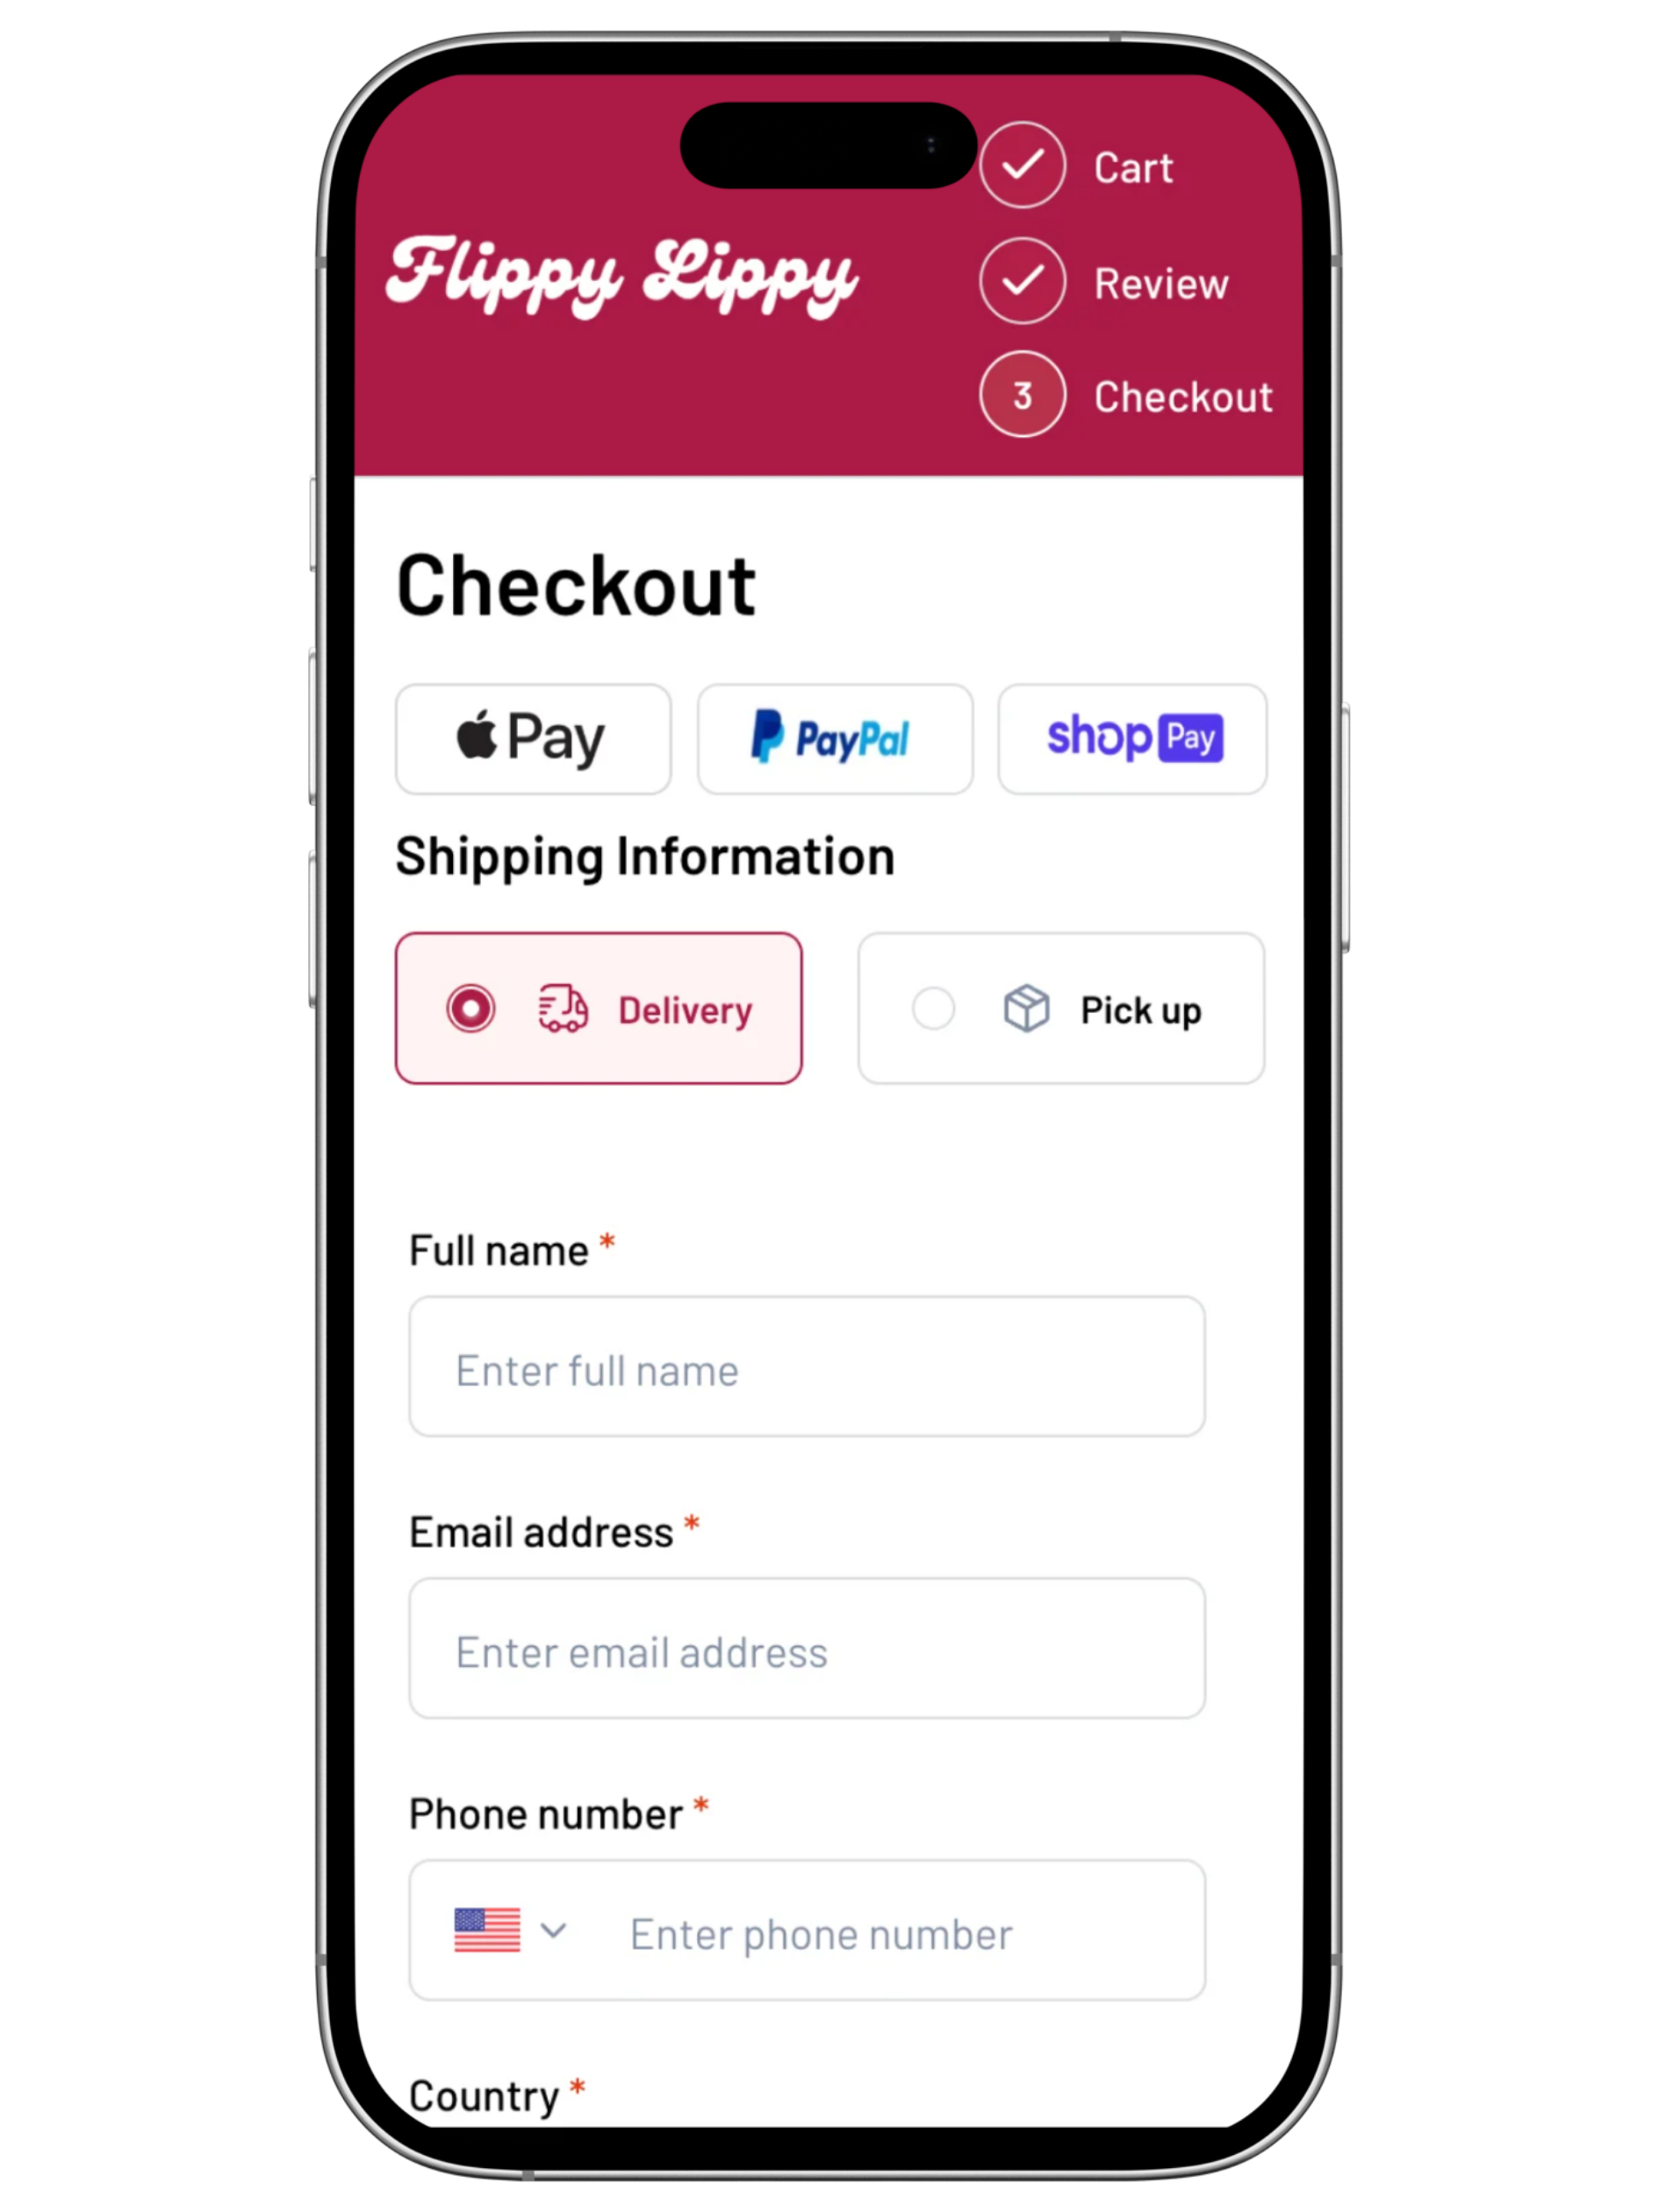
I designed this page to be a short, simple, standardized checkout flow with the goal of minimizing transaction friction and optimizing conversions. The simplified layout paired with a limited color palette optimizes navigation and leaves the page feeling more professional, which helps to make the transaction feel trustworthy.
——————————————
—————————————
Another thing I did to optimize the checkout flow was implement one-tap payment widgets for Apple Pay, PayPal, and Shop Pay. I think this goes a long way in reducing transaction friction, especially for mobile users.
—
Hi-Fi Wireframes - Home Page
—
Hi-Fi Wireframes - Product Display
—
Hi-Fi Wireframes - Checkout Page
—
Style Guide
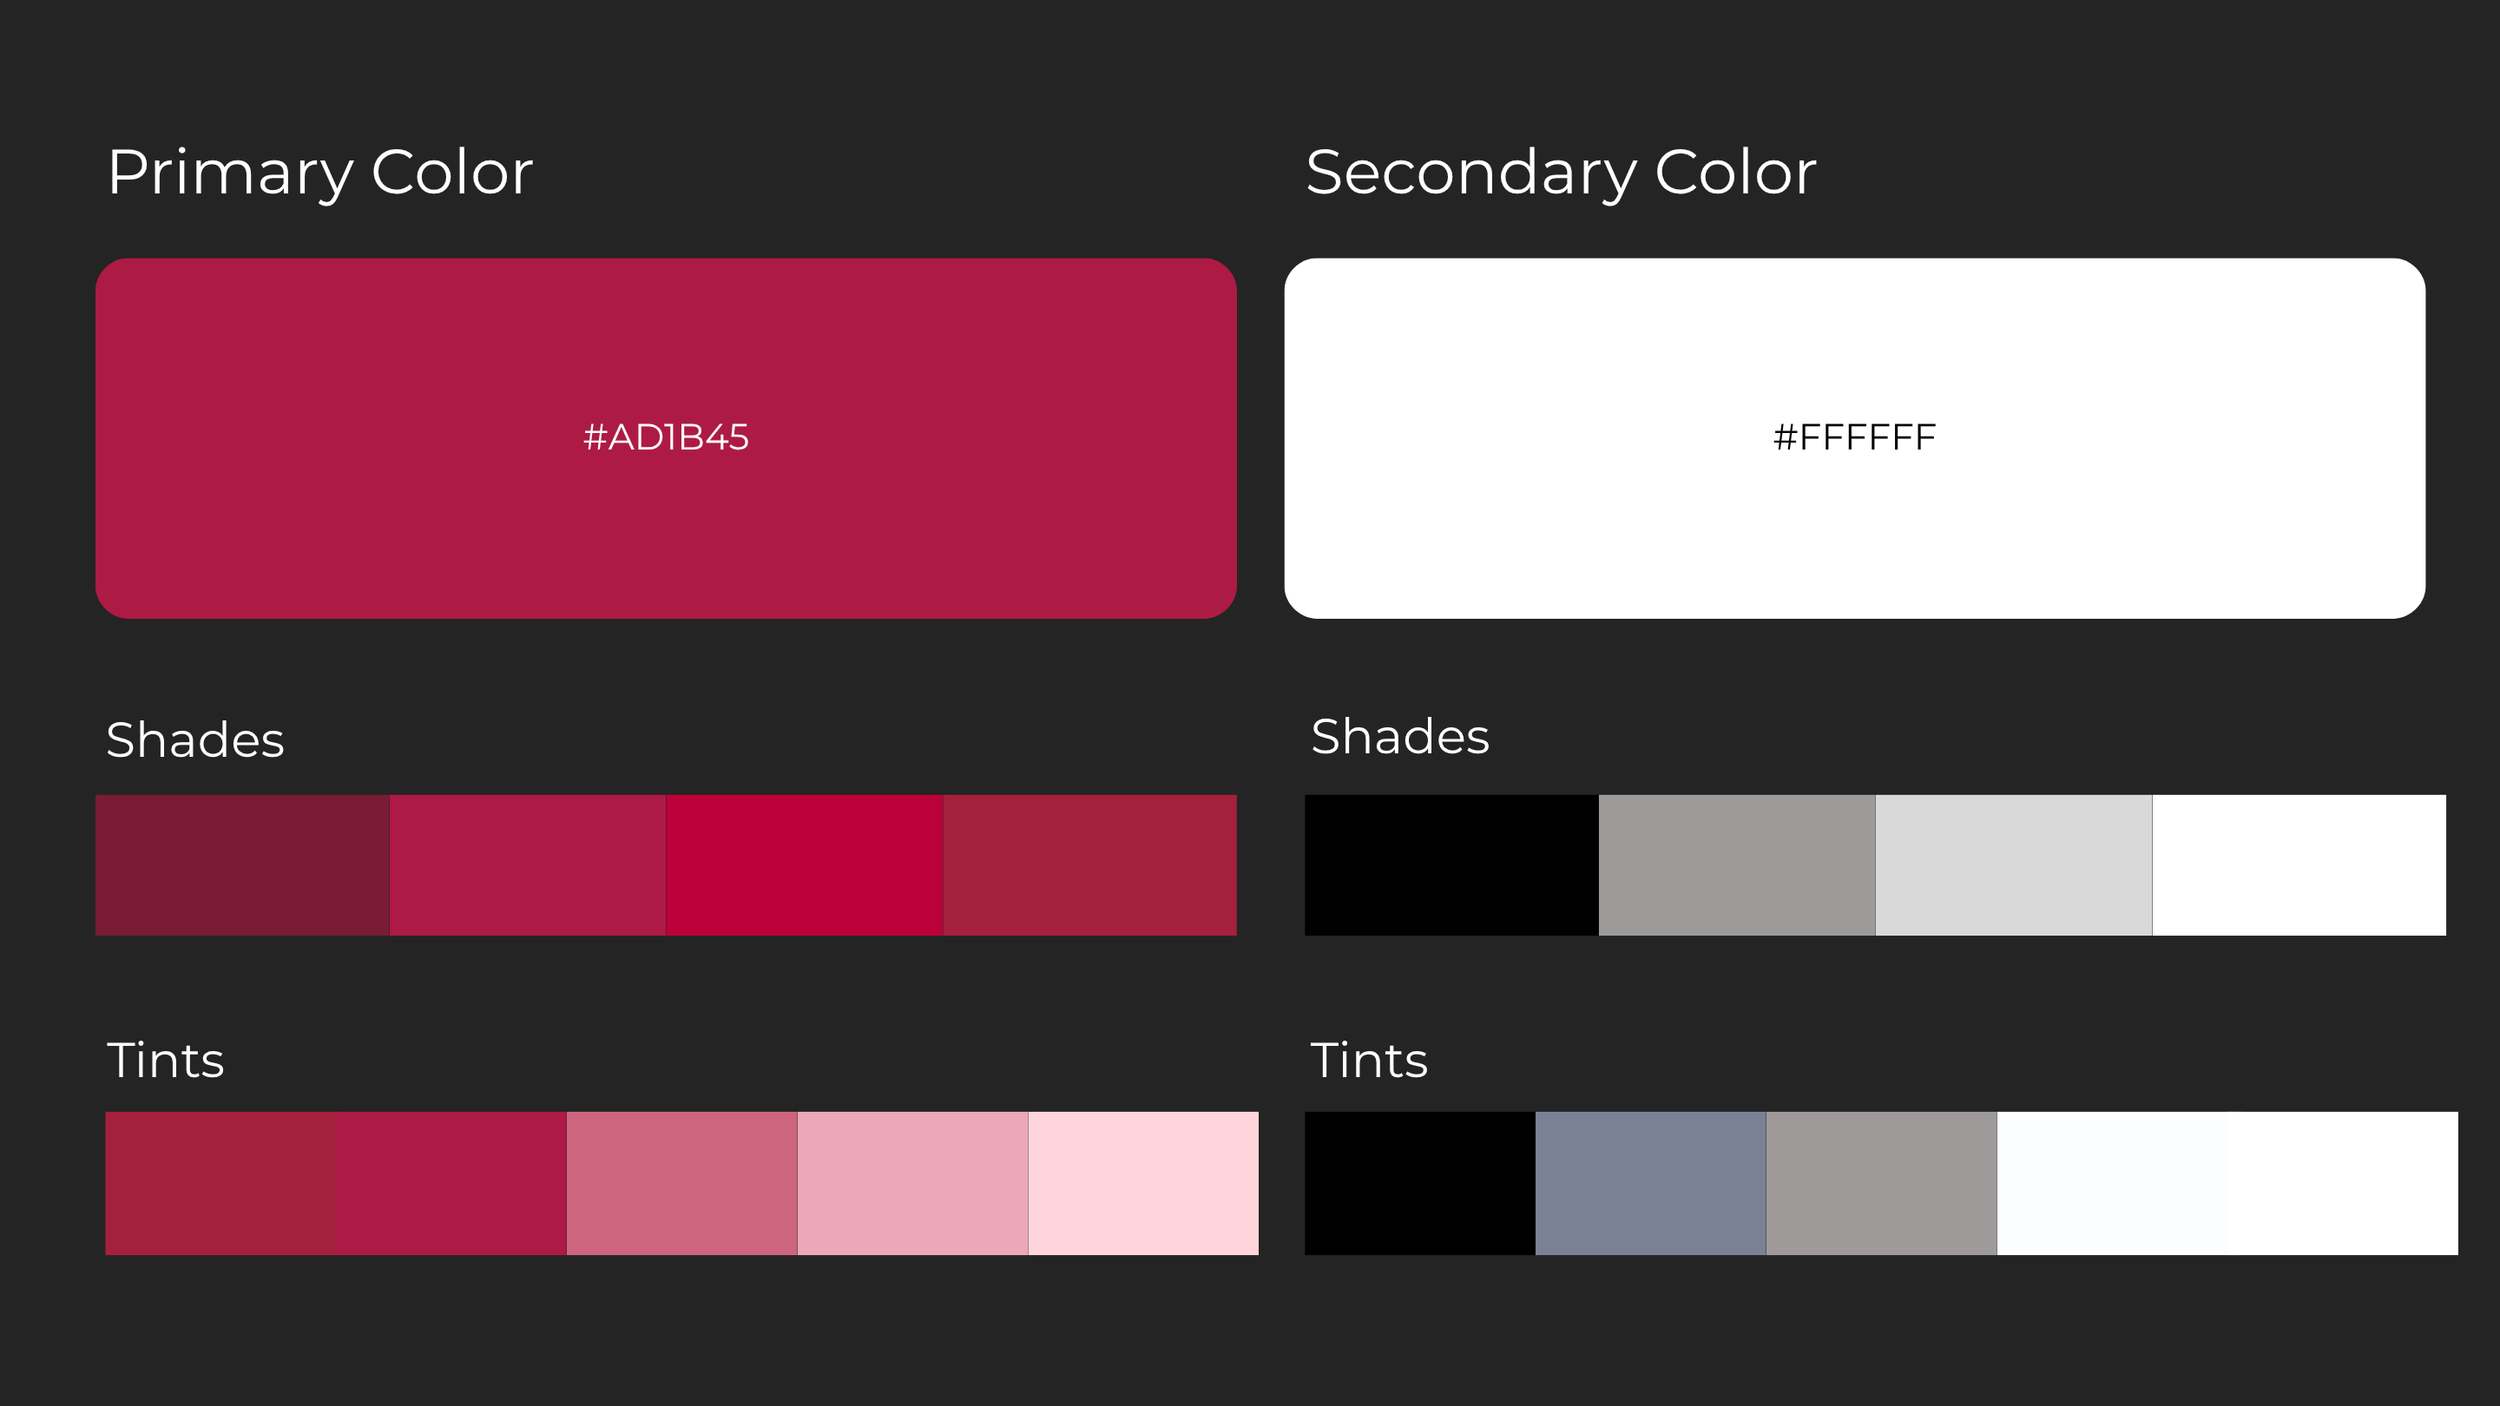
—
Color Palette
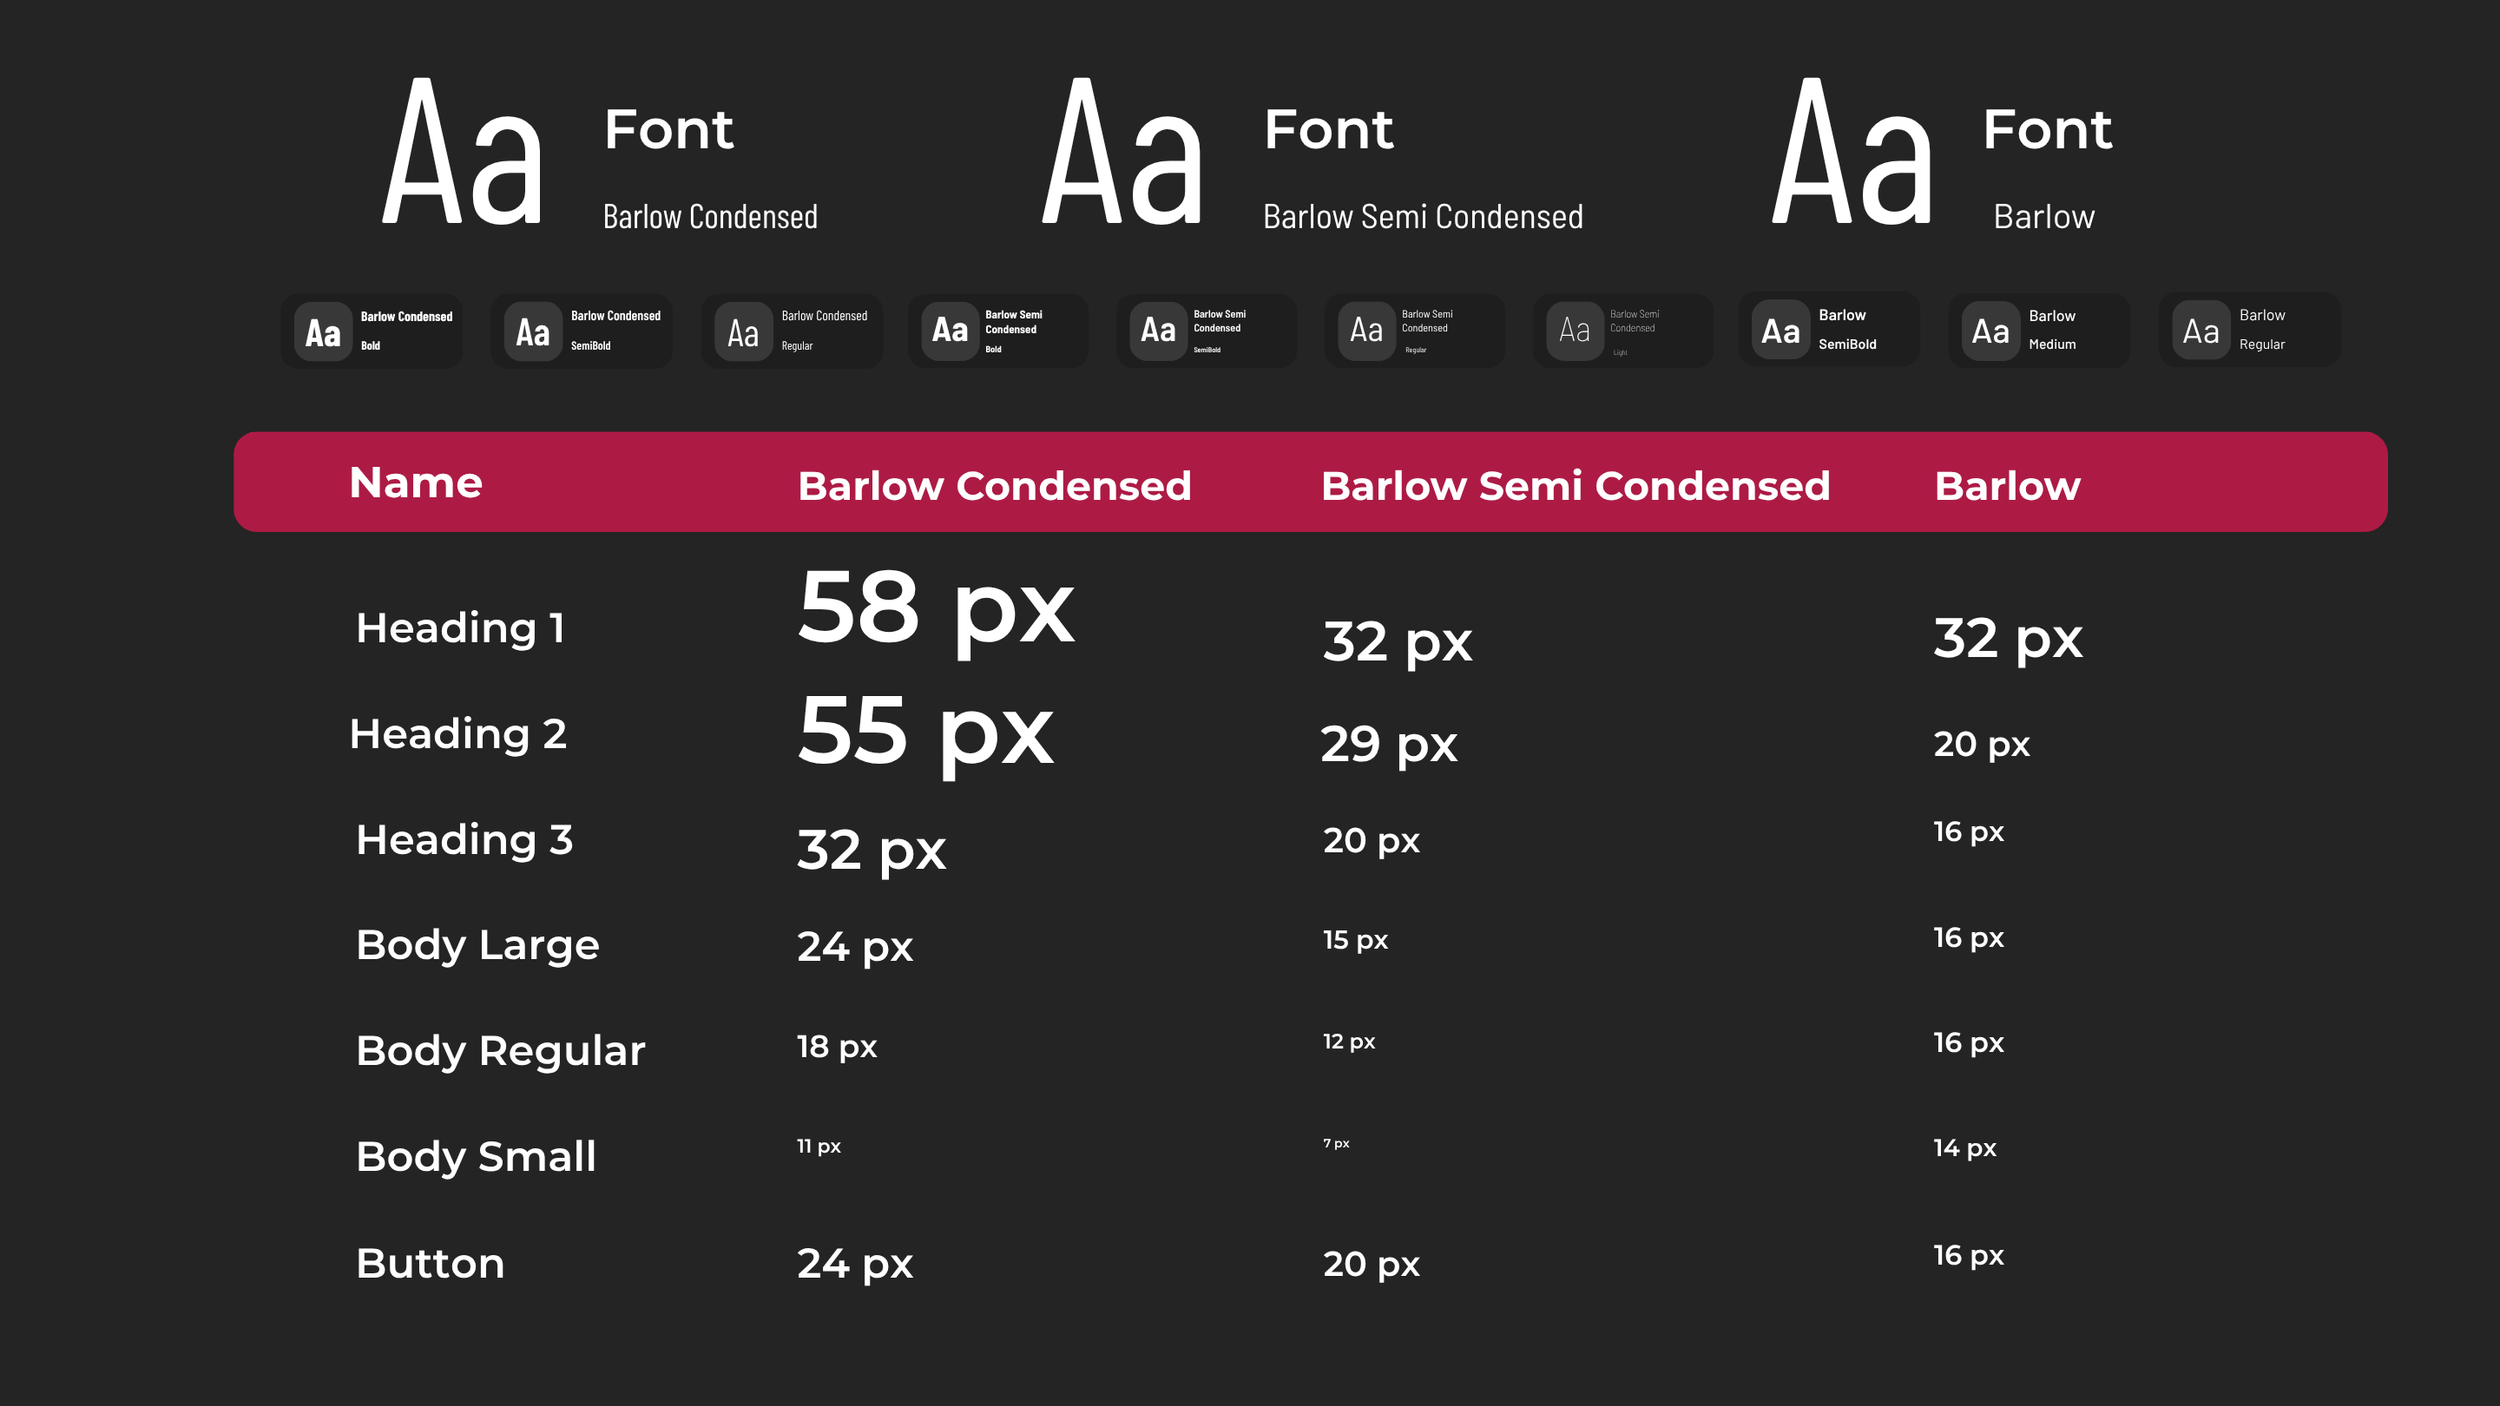
Typography

Iconography
Key Takeaways
Key takeaways from the case study are that a mobile-first, optimized information architecture is essential for success in the current direct-to-consumer beauty market, where competitors see up to 77% of their audience on mobile. To boost conversion rates, the ideal e-commerce design must prioritize express payment options,a balance between aesthetic visuals and clinical legitimacy, and technical optimization.
—
Sources Cited
Deloitte. (2024, May 27). Deloitte’s 2024 Gen Z and Millennial Survey finds these generations stay true to their values as they navigate a rapidly changing world [Press release]. https://www.deloitte.com/cn/en/about/press-room/deloitte-2024-gen-z-and-millennial-survey.html
Dynamic Yield. (n.d.). Device usage statistics for eCommerce. Dynamic Yield Marketing Benchmarks. https://marketing.dynamicyield.com/benchmarks/device-usage/
Semrush. (2023, May 8). What is bounce rate & what is a good bounce rate? Semrush Blog. https://www.semrush.com/blog/bounce-rate/
Semrush. (n.d.). Summerfridays.com website overview. Semrush Traffic Analytics. Retrieved June 28, 2026, from https://www.semrush.com/website/summerfridays.com/overview/
Similarweb. (n.d.). Laneige.com traffic analytics, ranking & audience insights. Similarweb Digital Data. Retrieved June 28, 2026, from https://www.similarweb.com/website/laneige.com/
Statista. (n.d.). Statista business data and market research platform. https://www.statista.com/